Showing posts with label Crude Oil. Show all posts

Sunday, June 29, 2008

Gold Price Analysis


22 – 27 June 2008 August Gold (COMEX GCQ8 , CBOT ZGQ8 & YGQ8)


August gold future contracts ranged 56$ (~877$ - ~933$). Gold begun the week on the weak side (price did not make a lower low vs. previous week) but finished rather strong.

Support zones for GCQ8 : 875$ , 860$, 850$ and lower.

Resistance zones for GCQ8: 940$, 960$ - 964$ and 1041$.

August gold futures (GCQ8) 8 hours chart

comex gold future chart


Note: Gold / Crude oil ratio at historic lows

Thursday, April 12, 2007

Gold Oil Ratio

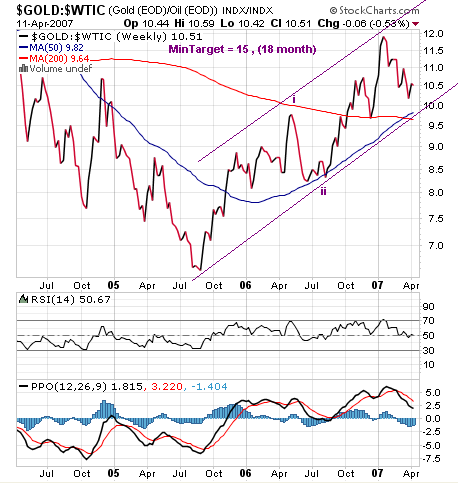
Just a quick update for this very important ratio...

Bullish: note the 50/ 200 MA crossover on the weekly chart, this crossovers doesn’t happen too often. PPO is bearish but above zero, RSI at 50. Short term might drop some but going higher. Minimum target = 15, 18 month time frame.


Gold Oil Ratio chart


Related:


Previous gold / oil ratio charts


Previous crude oil charts

Wednesday, February 07, 2007

Gold, Silver, Crude & Dow

Dear readers,

I'm posting gold and silver spot weekly charts along several gold ratio charts (Dow Jones, crude oil and silver). Please refer to the latest WTI crude oil charts review and this old post:

http://globalgold.blogspot.com/2006/10/dowgold-goldoil-ratios-update.html


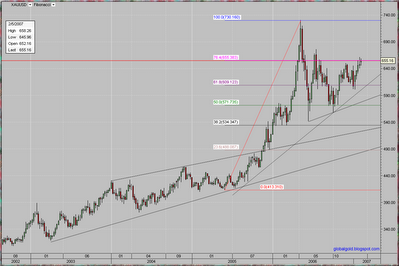
spot gold weekly chart

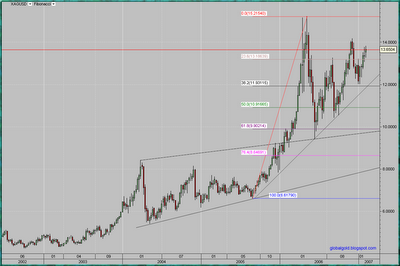
spot silver weekly chart


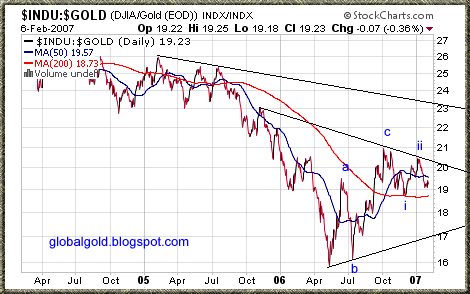
Dow Jones gold ratio chart

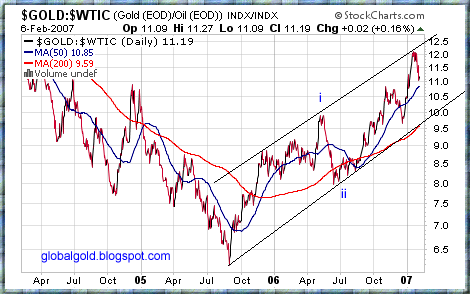
gold WTI crude oil ratio chart

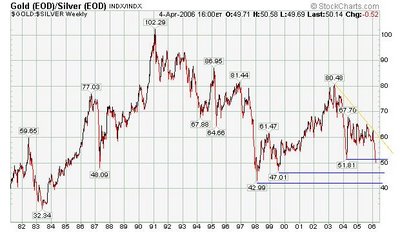
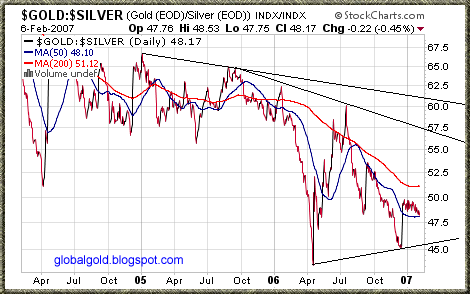
gold silver ratio chart

Tuesday, October 03, 2006

Dow/Gold , Gold/Oil Ratios – Update

1) The Dow Jones Industrial Average made a new all times closing high of 11,727.

2) Gold is sharply lower. Cbot gold trading had another serious malfunction today (not the first one this year…), AMEX GOLD BUGS INDEX is down 6.67% for the day.

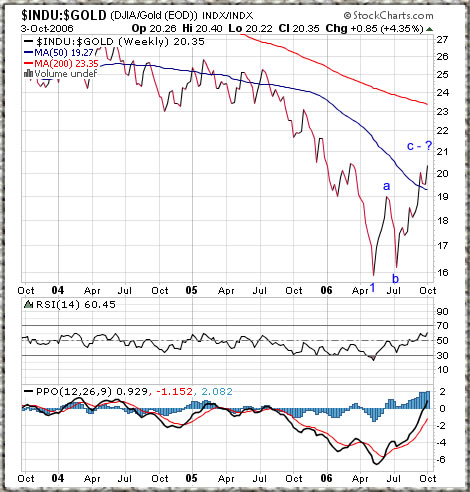
3) The Dow / Gold ratio is nearing completion of an A-B-C correction wave – in my opinion.

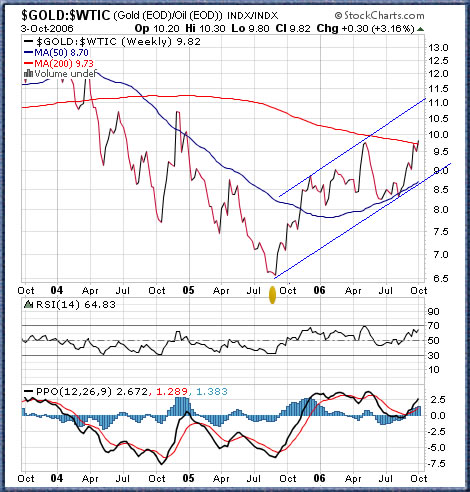
4) The Gold/Oil ratio closed above its 200 weekly moving average for the first time since early 2004.

for more information and charts of gold ratios, See this post : The importance of the Dow Jones / Gold, Gold / Oil & Gold / Silver ratios.


See also HUI/Gold ratio.

Dow/Gold ratio chart

Gold/Oil ratio chart

Tuesday, May 23, 2006

Gold & Silver Market Update , Charts

Gold and Silver, metals and most commodities had relatively strong upward movement today. The Gold Silver ratio (XAU / XAG) = ~ 51.54, Dow / Gold = ~ 16.67, Gold / Crude Oil (Light Sweet Crude Oil Future July 2006) = ~9.35.

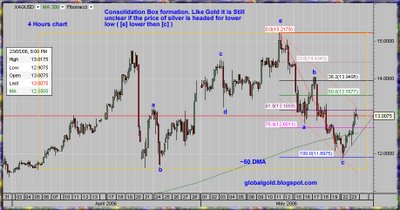
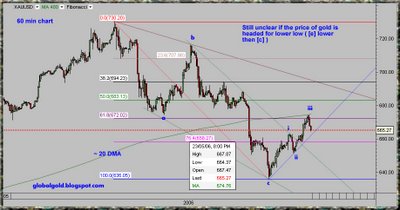
Technically it is still unclear if the price of gold is headed for lower low ( [e] lower then [c] ) or else the bottom is in and higher highs will follow. For basic yet excellent Elliott wave tutorial see EWI – might need registration. What else ? - See this Interesting Gold Market report.

Click on the charts below to enlarge:

Spot Silver chart

Spot Gold chart

Saturday, May 13, 2006

Gold , Silver market update

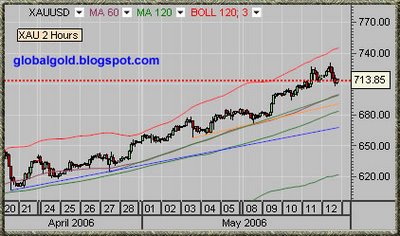
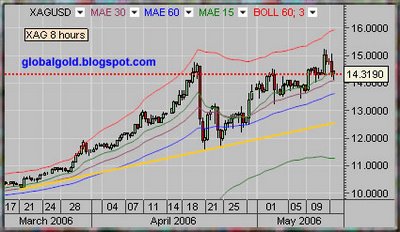
The Gold Silver ratio (XAU / XAG) = ~49.85, Dow / Gold = ~15.94, Gold / Oil (Light Sweet Crude) = ~9.92. Here are Spot Gold (XAU) and Spot Silver (XAG) intraday charts annotated with moving averages, trend lines and Bollinger bands.

XAU, Spot gold intraday chart

XAG, Spot silver intraday chart

Related :

Monday, May 08, 2006

Gold / Oil ratio update

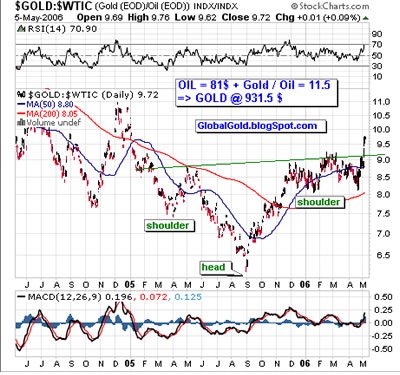
At February 10, 2006 I posted that I see a pattern of inverted head and shoulders on the Gold / Oil ratio chart. Since then the gold / oil ratio moved higher, closer to the pattern price target of ~ 11.50. Oil and Gold both moved higher but gold have outperformed oil (gained more percentage). At April 14 , 2006 I posted an oil chart - New all time high for crude oil (WTI) , and indicated a price target of 81$ per barrel of WTI crude oil. 81$ x 11.5 = 931.5$ per gold oz, this price target is less then one percent lower then the price target of 939$ per gold oz - which is based on the average positive rate of change for gold since the start of the second leg up (Elliott Wave III) of the great global gold bull market (GGGBM) – see Gold price prediction 2006, see also The importance of the Dow Jones / Gold, Gold / Oil & Gold / Silver ratios.

Gold / Oil ratio chart

Van Eck Seeks SEC Approval for Gold Shares ETF

Tuesday, April 04, 2006

The importance of the Dow Jones / Gold, Gold / Oil & Gold / Silver ratios

Dow Jones / Gold, Gold / Oil & Gold / Silver ratios are some of the most Interesting and informative pieces of data, here is why:

When we compare the Price of gold to the price of the two other commodities or the old Dow Jones index the value of the dollar becomes a non issue. It is a simple math exercise, when we look at the price of the Dow , Silver & Oil, we actually look at:

Dow (1 index unit) / USD(1 ? unit ), Silver(1 oz unit) / USD (1 ? unit) & Oil (1 Barrel unit) / USD (1 ? unit).

So if we divide Dow with Gold , Gold with Silver or Oil we can simply ignore the denominator (the USD in this case) according to simple algebra (fraction division law), here is an example :

(A/B)/(C/D) = (A/B)*(D/C) = AD/BC

Likewise:


[Dow (1 index unit) / USD (1 ? unit)] / [Gold(1 oz unit) / USD (1 ? unit)] =

[Dow (1 index unit) / USD (1 ? unit)] * [USD (1 ? unit) / Gold(1 oz unit)] =

[Dow (1 index unit) * USD (1 ? unit)] / [USD (1 ? unit) * Gold(1 oz unit)] =

Dow (1 index unit) / Gold(1 oz unit) =>

This ratio is not directly dependent on the USD (or any other currency)

As you notice each of the objects is measured by a constant measurement unit: Gold and Silver are measured in troy ounce or other weight unit , crude oil is usually measured in barrels or other volume unit, The Dow Jones is measured with index unit. Currencies like the US dollar also pretend to be a basic measure unit , but unlike troy ounce, barrel or any other physical measurement unit currencies are non constant and not stable.
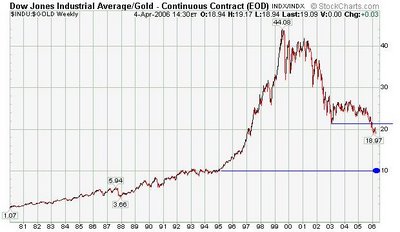
 Dow Jones / Gold ratio chart

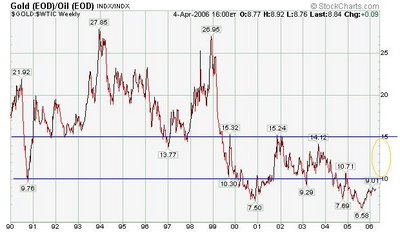
crude oil / Gold ratio chart

silver / Gold ratio chart

Friday, February 10, 2006

Gold / Oil ratio

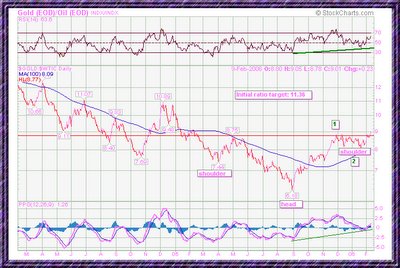
Not so good action for the precious metals complex today, Gold and Silver are trapped in a relatively tight trading range between this week highs and lows. However, the gold oil ratio made a one year new high on a closing base. I see a pattern of inverted head and shoulders on the gold / oil ratio chart. I'm not an oil bear so if an average crude oil price of 60$ is assumed the initial target for gold according to the pattern would be about 681$.

See my other web pages for charts and information regarding:

Commodities

Gold and Silver stocks


Click on the chart below to enlarge:

Gold / Oil ratio

Saturday, January 14, 2006

Gold Oil ratio

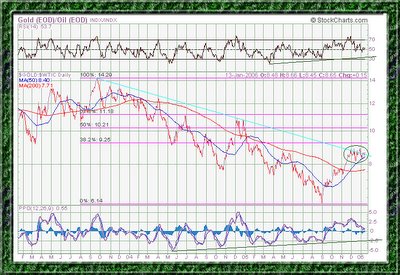
The gold oil ratio is still historically very low, in other words: gold is still cheap also when compared to oil.

See my previous review of gold oil ratio (weekly chart):
http://globalgold.blogspot.com/2005_12_25_globalgold_archive.html
Oil itself has more then a few bullish fundamentals and seems at the beginning of a recovery from the latest correction. see oil charts here:
http://cmd-chart.blogspot.com
Overall and in my opinion both Gold and Oil are headed higher in 2006 but gold should finally outperform.

Click on the chart below to enlarge:

Gold Oil ratio chart

Sunday, December 25, 2005

Gold and Oil ratio

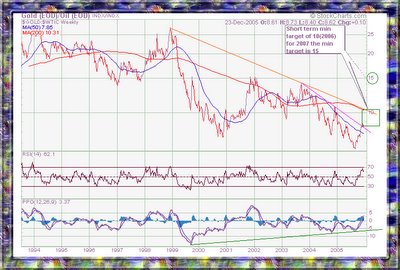
How many barrels of Texas Light sweet crude oil you can buy with one ounce of gold?

I will post more about this important ratio as well as other gold ratios in the future , but for now just two points :

1)Gold is far more ancient commodity then oil.

2) Oil is consumed and destroyed , Gold is durable !


Here is a 12 year chart of gold/oil ratio.


Gold and Oil ratio chart