Showing posts with label Dow Jones. Show all posts

Sunday, June 22, 2008

Gold market summery for 15 – 21 June 2008

It was an inside week – this week the GCQ8 contract traded (~868$ - 912$) within last week range (~ 859$ - 913$) . gold is trading comfortably in recent range with a slight positive bias as the weekly closing price was higher then last week and also the contract closed at the higher part of the trading range.

Equity market are quickly approaching 2008 lows and $indu:gold ratio is probably ready for new lows.


GCQ8 (August Gold) 480 minutes chart


GCQ8 chart


Dow Jones / Gold ratio linear chart


dow gold chart

Monday, August 20, 2007

GGP Update

Dear readers,

In recent weeks the Dow Jones World Index had it's worst decline since 2002.
On the same page the VIX reached the highest point since 2003.

Dow Jones World Index


Given recent moves in major currencies (EURJPY 169 – 149, GBPJPY 251-219) gold have been as stable as one can expect from a major independent private currency. This is very encouraging to say the least. Odds still favors higher gold rates more then lower USD index.


Gold daily chart annotated with wave count

Same 1-2 extending

xauusd


Silver daily chart annotated with Elliott wave count

Retraced September 2006 – February 2007 secondary advance

xagusd

Tuesday, June 26, 2007

Gold , Silver

Gold and particularly silver are down sharply today. Gold and silver are about at the same point as in the beginning of the year and April 2006. Volume at futures exchanges was large. It was like traders got scared that their gold would catch rust. I estimate that the high volume was due to fundamentals, value and de hedging.

Dow Jones /Gold ratio making new highs, inline with recent out performance of stocks vs. gold. My opinion is that Higher gold price will be necessary for the continuation of the stocks bull market.


Gold (XAUUSD)

gold chart


Silver (XAGUSD)


silver chart


Some of you might want to read this article : Booms Were Made to Go Bust(Robert Kiyosaki)

Wednesday, February 07, 2007

Gold, Silver, Crude & Dow

Dear readers,

I'm posting gold and silver spot weekly charts along several gold ratio charts (Dow Jones, crude oil and silver). Please refer to the latest WTI crude oil charts review and this old post:

http://globalgold.blogspot.com/2006/10/dowgold-goldoil-ratios-update.html


spot gold weekly chart

spot silver weekly chart


Dow Jones gold ratio chart

gold WTI crude oil ratio chart

gold silver ratio chart

Tuesday, October 03, 2006

Dow/Gold , Gold/Oil Ratios – Update

1) The Dow Jones Industrial Average made a new all times closing high of 11,727.

2) Gold is sharply lower. Cbot gold trading had another serious malfunction today (not the first one this year…), AMEX GOLD BUGS INDEX is down 6.67% for the day.

3) The Dow / Gold ratio is nearing completion of an A-B-C correction wave – in my opinion.

4) The Gold/Oil ratio closed above its 200 weekly moving average for the first time since early 2004.

for more information and charts of gold ratios, See this post : The importance of the Dow Jones / Gold, Gold / Oil & Gold / Silver ratios.


See also HUI/Gold ratio.

Dow/Gold ratio chart

Gold/Oil ratio chart

Tuesday, May 23, 2006

Gold & Silver Market Update , Charts

Gold and Silver, metals and most commodities had relatively strong upward movement today. The Gold Silver ratio (XAU / XAG) = ~ 51.54, Dow / Gold = ~ 16.67, Gold / Crude Oil (Light Sweet Crude Oil Future July 2006) = ~9.35.

Technically it is still unclear if the price of gold is headed for lower low ( [e] lower then [c] ) or else the bottom is in and higher highs will follow. For basic yet excellent Elliott wave tutorial see EWI – might need registration. What else ? - See this Interesting Gold Market report.

Click on the charts below to enlarge:

Spot Silver chart

Spot Gold chart

Thursday, May 18, 2006

Gold Market update

The Gold Silver ratio (XAU / XAG) = ~ 53.72, Dow / Gold = ~ 16.31, Gold / Crude Oil future = ~9.77. Gold is down about 50$ since the most recent peak (~730$). The pullback is purely technical and the gold market fundamentals have not changed.

Technically there is one last relevant short term trend line in place if it doesn’t hold then watch for horizontal support and Fibonacci lines. If I had to put a short term trade: It will be at current price with a stop just below the 20 DMA. Investors, Shorts and those who hold no position in gold should use any weakness and buy.

Click on the chart below to enlarge (FireFox browser highly recommended – link for download at the left bottom of this page)

gold price spot chart

Friday, April 07, 2006

Gold / $, Gold / € & Gold / ¥ Correlation

I haven't noticed any interesting or important news which are directly related to the gold and silver markets. Just the usual Silver ETF hype, Inflation deflation debates, Commodity bull cycle, Debts and Interest rates & the usual gossip.
Since Jan 01 2006 Gold is up against the Euro (€) ~ 11.50% , up against the USD ($) ~ 13.74% & up Against the Yen(¥) 14.24%
The gold silver ratio (XAU/XAG) = ~ 48.75, Dow / Gold = ~18.91, Gold / Crude oil = ~8.72.

Gold in terms of EURO, USD & YEN is showing pretty good correlation.

Gold in terms of EURO, USD & YEN  chart

2 hours intraday spot silver chart

2 hours intraday spot silver chart

2 hours intraday spot gold chart

2 hours intraday spot gold chart

Gold channel chart

Gold spot channel chart

Tuesday, April 04, 2006

The importance of the Dow Jones / Gold, Gold / Oil & Gold / Silver ratios

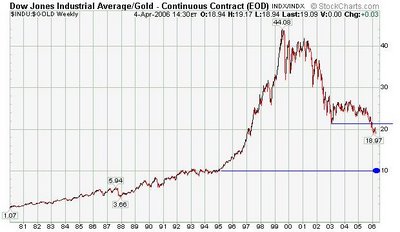
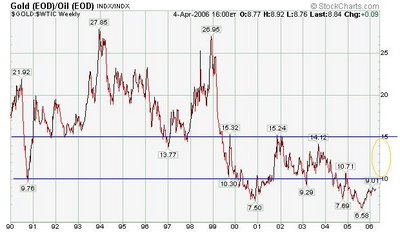
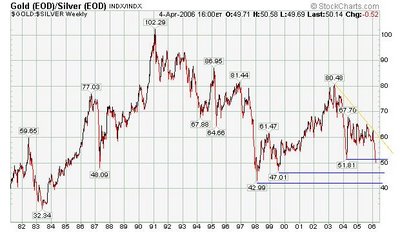
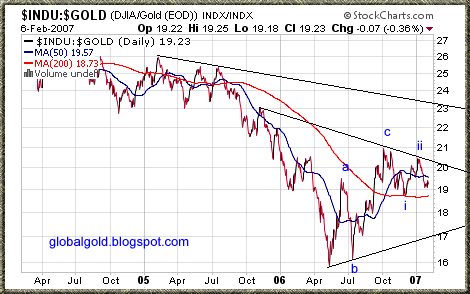
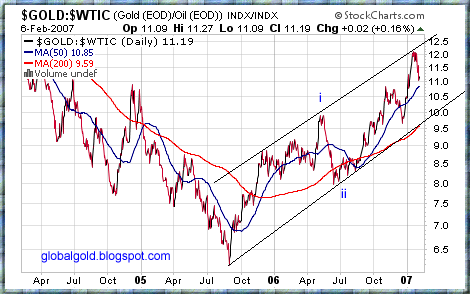
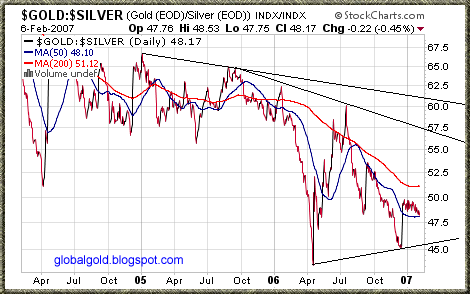
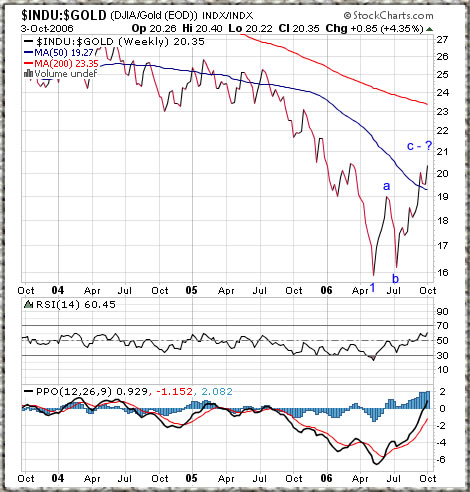
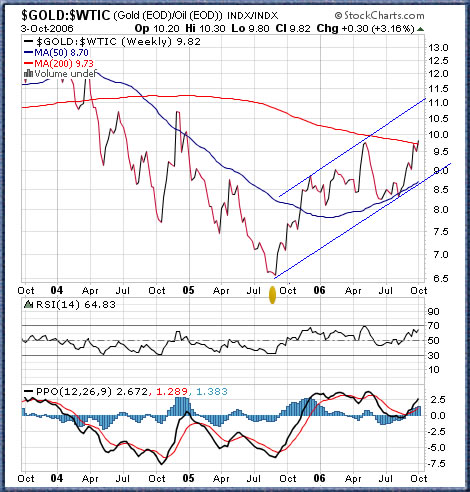
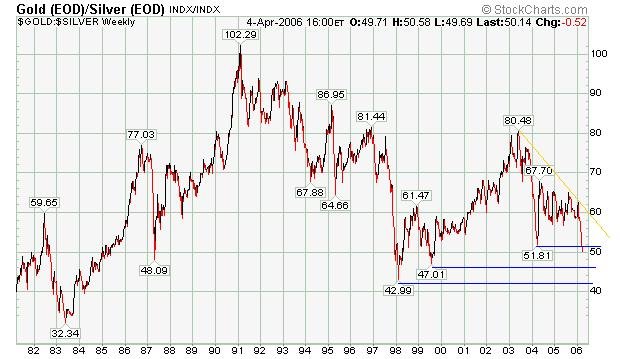
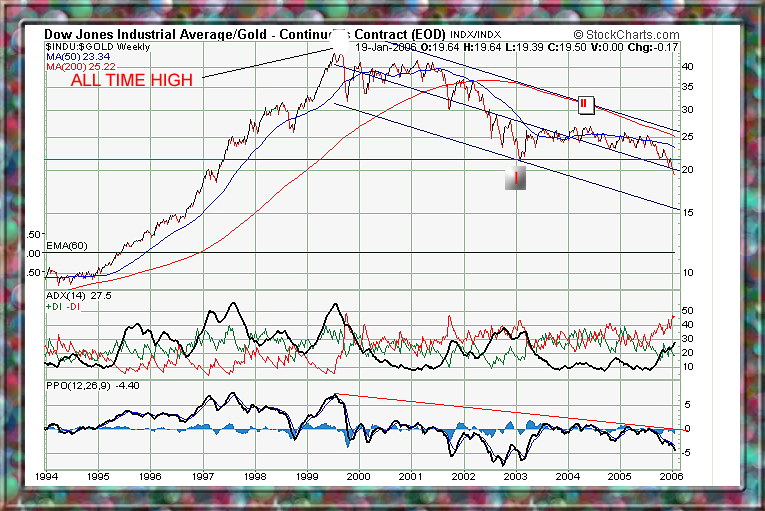
Dow Jones / Gold, Gold / Oil & Gold / Silver ratios are some of the most Interesting and informative pieces of data, here is why:

When we compare the Price of gold to the price of the two other commodities or the old Dow Jones index the value of the dollar becomes a non issue. It is a simple math exercise, when we look at the price of the Dow , Silver & Oil, we actually look at:

Dow (1 index unit) / USD(1 ? unit ), Silver(1 oz unit) / USD (1 ? unit) & Oil (1 Barrel unit) / USD (1 ? unit).

So if we divide Dow with Gold , Gold with Silver or Oil we can simply ignore the denominator (the USD in this case) according to simple algebra (fraction division law), here is an example :

(A/B)/(C/D) = (A/B)*(D/C) = AD/BC

Likewise:


[Dow (1 index unit) / USD (1 ? unit)] / [Gold(1 oz unit) / USD (1 ? unit)] =

[Dow (1 index unit) / USD (1 ? unit)] * [USD (1 ? unit) / Gold(1 oz unit)] =

[Dow (1 index unit) * USD (1 ? unit)] / [USD (1 ? unit) * Gold(1 oz unit)] =

Dow (1 index unit) / Gold(1 oz unit) =>

This ratio is not directly dependent on the USD (or any other currency)

As you notice each of the objects is measured by a constant measurement unit: Gold and Silver are measured in troy ounce or other weight unit , crude oil is usually measured in barrels or other volume unit, The Dow Jones is measured with index unit. Currencies like the US dollar also pretend to be a basic measure unit , but unlike troy ounce, barrel or any other physical measurement unit currencies are non constant and not stable.

 Dow Jones / Gold ratio chart

crude oil / Gold ratio chart

silver / Gold ratio chart

Friday, January 20, 2006

Dow Gold ratio

The Dow: Gold ratio is clearly on its second wave down, moving out of extreme cyclical valuation. History show that Dow is still much overvalued compared to gold.

Click on the charts below to enlarge:


Dow Gold ratio


Dow Gold ratio