


Here is an interesting site that collect eBay gold and silver auction data.
http://www.24hgold.com/english/buy_sell_gold_coins.aspx
Premiums over spot are high to say the least.
Showing posts with label Silver. Show all posts
Showing posts with label Silver. Show all posts
Friday, December 05, 2008
Sunday, November 02, 2008
Gold and Silver Charts
September bottoms failed to hold for both gold and silver. The price of Gold made a new bottom at around 681$ for spot gold. The price of spot silver traded as low as 8.47$.
Gold support and resistance zones: 541$, 559$, 607$, 638$, 681$ <> 744$, 772$, 845$, 930$, 988$,1032$

Silver support and resistance zones: 5.20$, 6.30$, 7.23$, 8.46$<> 11.03$, 12.02$, 12.59$, 13.07$, 13.73$, 16.48$, 19.44$, 21.34$.
Gold support and resistance zones: 541$, 559$, 607$, 638$, 681$ <> 744$, 772$, 845$, 930$, 988$,1032$

Silver support and resistance zones: 5.20$, 6.30$, 7.23$, 8.46$<> 11.03$, 12.02$, 12.59$, 13.07$, 13.73$, 16.48$, 19.44$, 21.34$.

Sunday, June 08, 2008
August Gold (GCQ8) & Spot Silver (XAGUSD) update
Dear readers,
This last week we have probably seen a successful retest of the low of 864$ and currently gold is trying to move higher towards resistance zone at ~940$.
Support zones for the GCQ8 contract : ~868$, ~864$, ~850$ and Fibonacci levels.
Resistance zones for GCQ8 : ~940$, ~960$, ~964$, ~1040$ and Fibonacci levels.
GCQ8 August gold contract - 8 hours linear Fibonacci chart
Silver has been consolidating and have first support at the 15.96$ – 16.40$ zone and resistance at the 18.33$ – 18.72$ zone. (spot silver prices)
XAG/USD - silver spot daily chart

This last week we have probably seen a successful retest of the low of 864$ and currently gold is trying to move higher towards resistance zone at ~940$.
Support zones for the GCQ8 contract : ~868$, ~864$, ~850$ and Fibonacci levels.
Resistance zones for GCQ8 : ~940$, ~960$, ~964$, ~1040$ and Fibonacci levels.
GCQ8 August gold contract - 8 hours linear Fibonacci chart

Silver has been consolidating and have first support at the 15.96$ – 16.40$ zone and resistance at the 18.33$ – 18.72$ zone. (spot silver prices)
XAG/USD - silver spot daily chart

Sunday, April 27, 2008
Gold futures (GCM8) and silver (xagusd) technical update
Gold is down trending and aiming to break support at first April low (876.5$ for GCM8). The price of gold failed to penetrate the 50% Fibonacci resistance at 957.54 and selling pressure pushed the price lower.
Resistance at diagonal upper trend line, ~906.5$ , ~938$ (38.2%Fibonacci) , ~976$ (61.8% Fibonacci) , ~1003$(76.4% Fibonacci) and the high of 1038$.
Support at 876.5$ ,~860, 850$ -840$ , ~820$, 792$, ~750$.
June Comex gold futures (GCM8) 8 hours chart

Gold spot weekly chart

Silver is down trending as well and already lost 5$ from its top at 21.33$ (spot price)
Silver Spot weekly chart

Sunday, March 30, 2008
Gold chart & update
The climate: Continued stress of banks and other financial institutions. In my opinion the source of this stress is illiquidity of non trade able (unlisted at a public exchange) financial “products”.
Outlook: High volatility is present in all markets, extreme events in which investment banks remove huge amounts of liquidity while central banks creates huge amount of liquidity to fill the “holes”.
Technical:
Recent pullback was the biggest since August 2007 bottom, the spot price of gold came down ~128$ (905$) since it's top at 1033$. The spot price of silver dropped from it's top at ~21.35 to ~16.67$.
The trend line which connect the August and November bottoms is still intact. See the chart below for Fibonacci proportions and less steep trend lines. If the recent bottom zone at 905$ - 884$ will not hold then the price might retrace to about 790$ if not lower.
Later on and depending on the fundamental events which will be reflected on the charts – gold might move higher or maybe much higher then recent highs.

Monday, November 12, 2007
XAUUSD, XAGUSD Charts
Significant corrections are taking place for both gold and silver. So far this is the sharpest drop seen since the mid august bottom. Each Fib line is currently a possible downside target.
Personally, I observe that at the moment some other markets offer superior short term trading opportunities.
Silver (Spot price) 8 hours chart

Gold (Spot price) 8 hours chart

Personally, I observe that at the moment some other markets offer superior short term trading opportunities.
Silver (Spot price) 8 hours chart

Gold (Spot price) 8 hours chart

Monday, August 20, 2007
GGP Update
Dear readers,
In recent weeks the Dow Jones World Index had it's worst decline since 2002.
On the same page the VIX reached the highest point since 2003.

Given recent moves in major currencies (EURJPY 169 – 149, GBPJPY 251-219) gold have been as stable as one can expect from a major independent private currency. This is very encouraging to say the least. Odds still favors higher gold rates more then lower USD index.
Gold daily chart annotated with wave count
Same 1-2 extending

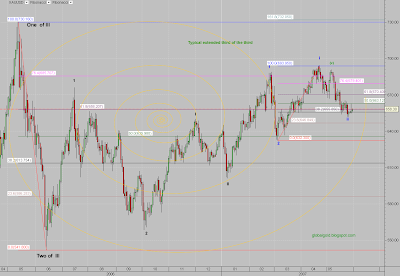
Silver daily chart annotated with Elliott wave count
Retraced September 2006 – February 2007 secondary advance

In recent weeks the Dow Jones World Index had it's worst decline since 2002.
On the same page the VIX reached the highest point since 2003.
Given recent moves in major currencies (EURJPY 169 – 149, GBPJPY 251-219) gold have been as stable as one can expect from a major independent private currency. This is very encouraging to say the least. Odds still favors higher gold rates more then lower USD index.
Gold daily chart annotated with wave count
Same 1-2 extending

Silver daily chart annotated with Elliott wave count
Retraced September 2006 – February 2007 secondary advance

Tuesday, July 17, 2007
Gold and Silver Charts
Dear readers,
Yet again, minor consolidation might be over; gold and silver should be ready to move higher. Just my opinion, only the time will tell.
(SIU7) COMEX September Silver Intraday Chart (2 hours sticks)

(ZGQ7) CBOT August Gold Intraday Chart (2 hours sticks)
Yet again, minor consolidation might be over; gold and silver should be ready to move higher. Just my opinion, only the time will tell.
(SIU7) COMEX September Silver Intraday Chart (2 hours sticks)

(ZGQ7) CBOT August Gold Intraday Chart (2 hours sticks)

Tuesday, July 10, 2007
XAU, XAG & Forex Commentary
Not much change in the USD price of gold (xauusd) today. Gold futures traded and closed slightly higher but priced in Euro and Yen gold is actually down today.
The Euro made a new all time high vs. the USD, EURUSD ~= 1.3740. Note that pre issued Euro high was EURUSD 1.4750, Long term (30 years) retro perspective EUR/USD chart.
Marginal carry traders capitulated as the Yen rallied strongly. Be careful with that one! , Seems like the carry trade become way over crowded as every one and his dog doing the thing.
Silver up, the high of the day was 13.085 for SIU7 (COMEX September contract)
Silver SIU7 Intraday Chart (2 hours sticks)

Saturday, July 07, 2007
XAGUSD Chart
Some initial upward movement for the price of gold and silver. Not surprising as buy signal was generated by the HUI/GOLD ratio. Silver outperformed and closed at the high for the week. A slight uptrend is apparent on the intraday chart. As you probably know all trend lines are made to be broken and the shorter the time frame the larger the chance that a trend line will be broken. Anyway, markets moves are not linear, markets moves in waves or more precisely fractal waves.
Spot Silver intraday 2 hours chart.

Spot Silver intraday 2 hours chart.

Thursday, July 05, 2007
Quick Update
Dear readers,
It is a given fact that gold reached a technical comfort zone. I find it funny to read commentary with price objectives slightly above, at or below gold mining break even point. It is a mystery how low the price of gold can be manipulated in a mission to hide competitive currencies devaluation on a global scale.
All charts and ratios considered I estimate that a volatile markup for the price of gold and silver should soon follow.
Wednesday, July 04, 2007
Recommended Readings
Individual gold trade this month
By Wang Lan (China Daily)
Updated: 2007-07-04 08:51
The beginning of gold trading by individual investors on the Shanghai Gold Exchange (SGE) later this month is expected to provide a welcome alternative at a time of high stock market volatility. -link
RTS Realtime Systems Group Offers Connectivity To Dubai Gold & Commodities Exchange
03/07/07
RTS Realtime Systems Group (RTS), a leading independent software vendor, announced that the firm is now offering access to the Dubai Gold & Commodities Exchange (DGCX). The move expands the RTS presence in the Middle East and further strengthens its leadership position in electronic trading software, with thousands of user connections to more than 85 exchanges and liquidity pools throughout the world.
-link
Warehouses to help stabilise gold prices
(03-07-2007)
The International Gold Council this year estimates that demand for gold in Viet Nam could reach 70-80 tonnes. A Brink’s Viet Nam representative, Ben Van Kerkwijk predicts in the short run demand will accelerate. - link
GLOBAL EXODUS FROM THE US DOLLAR IN MOTION by Gary Dorsch -link
The Silver Millionaire By David Morgan - link
Monday, July 02, 2007
Positive Reason
Interesting times head as significant adjustments are in the works. Currencies, Silver Gold, Oil, Stocks all in the equation with the most controlled item actually needs to be Interest rates.
Commodities continue to trade with a group and / or individual bias. Generally it might be the case that commodities are the best play as the long term (decades) cycle is probably most favorable for this asset class.
Gold and Silver fundamentals have never been better with global system adjustments seen as a long term positive. Significant amount of shorting taking place and some of it probably un hedged (naked).
Exact timing and finding reasons for the day to day action is tricky.
Friday, June 29, 2007
Silver
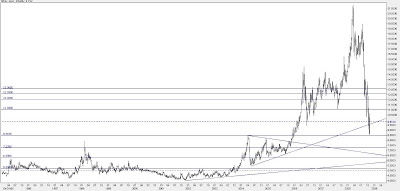
If enough cash based buying enters the physical silver market then regardless of the silver market fundamentals (which are supportive) the price will quickly rally. The move should be similar to the second half 2005<> first half 2006 in which silver climbed about 130% in 8 month. 12.30$ today is like 6.70$ in 2005 so the target is about 27.80$ which is between the short and long 261.8 Fibonacci levels.
Spot Silver {XAGUSD} Weekly Log Chart

Spot Silver {XAGUSD} Weekly Log Chart

Thursday, June 28, 2007
Update
It appears that after yesterday slump some technical repair is currently taking place. This is not the time to sell gold and silver as February 26 was not the time to buy. Yesterday action is nothing new for anyone watching the precious metals, gold has seen moves of ~ 40$ in 24 hours more then once , sharp moves like that are typical at bottoms or tops though it is not always the case.
For readers who need to buy physical gold and silver this is a rare opportunity and you might want to buy a larger amount then you normally do. Long term investors which buy gold physically or gold funds can enter the market gradually. Speculators need to be on the watch for buy signals.
I see quiet a few bearish gold articles with targets of 600$ and 570$ which should be viewed as a contrary indicator (The majority of investors and traders tend to be bearish at bottoms and bullish at tops). It appears there is allot of speculative short selling taking place with intention to capitalize on a falling gold and silver prices. Are the short sellers getting over confident? Time will tell…
If you think like I do that gold is in a multi years / decades bull market then you have to be bullish most of the time , sometimes natural but never bearish.
Overall, initiating bullish positions with medium to long term time frame seems favorable both in terms of price and time.

Bill Cara has posted about Gold mining costs and you might want to read that:
Goldminer Report
For readers who need to buy physical gold and silver this is a rare opportunity and you might want to buy a larger amount then you normally do. Long term investors which buy gold physically or gold funds can enter the market gradually. Speculators need to be on the watch for buy signals.
I see quiet a few bearish gold articles with targets of 600$ and 570$ which should be viewed as a contrary indicator (The majority of investors and traders tend to be bearish at bottoms and bullish at tops). It appears there is allot of speculative short selling taking place with intention to capitalize on a falling gold and silver prices. Are the short sellers getting over confident? Time will tell…
If you think like I do that gold is in a multi years / decades bull market then you have to be bullish most of the time , sometimes natural but never bearish.
Overall, initiating bullish positions with medium to long term time frame seems favorable both in terms of price and time.
Bill Cara has posted about Gold mining costs and you might want to read that:
Goldminer Report
Tuesday, June 26, 2007
Gold , Silver
Gold and particularly silver are down sharply today. Gold and silver are about at the same point as in the beginning of the year and April 2006. Volume at futures exchanges was large. It was like traders got scared that their gold would catch rust. I estimate that the high volume was due to fundamentals, value and de hedging.
Dow Jones /Gold ratio making new highs, inline with recent out performance of stocks vs. gold. My opinion is that Higher gold price will be necessary for the continuation of the stocks bull market.
Gold (XAUUSD)

Silver (XAGUSD)

Some of you might want to read this article : Booms Were Made to Go Bust(Robert Kiyosaki)
Wednesday, June 20, 2007
XAGUSD Chart
The Silver wave count seems to be a bit head of gold as observed by comparing recent cycles lows. Overall gold and silver haven't done much lately but continue to be attractive at current prices with significant upside potential.
XAGUSD Daily Chart

XAGUSD Daily Chart

Wednesday, May 30, 2007
XAUUSD Waves Update
Dear readers,
Gold have probably bottomed and in time will be headed higher to challenge recent highs at 700 U$D / 520 € / 83,000 ¥. Silver confirms this assumption and the silver /gold ratio shows relative strength.
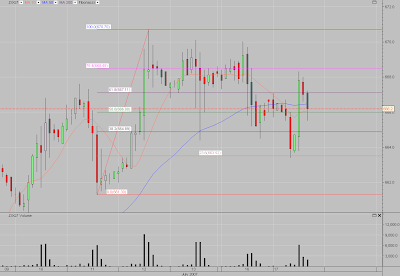
Elliott Waves Cyclical view: The advance from the recent low consist of multiple sequences of intraday impulsive 5 waves patterns (visible on minutes charts). Despite the recent failed (v)[green] wave within the last (i) [blue] wave, the previous bullish Elliott wave count remains intact .
The count on the chart below is consisted of multiple first and second waves which are typical for extended third of the third waves. If the count is valid then the lion part of the advance is yet to be seen. I see no reason to mention upside target for now, as, the 700 $ level along the Euro and Yen targets need to be challenged first.
Again, Forex and Metals traders should note the possibility that gold and silver can go up along a rising USD index. (See chart here)
Strategy: buy pullbacks as long as spot silver above 12.37$ and gold spot above 632$.
XAUUSD (spot gold) daily chart
Gold have probably bottomed and in time will be headed higher to challenge recent highs at 700 U$D / 520 € / 83,000 ¥. Silver confirms this assumption and the silver /gold ratio shows relative strength.
Elliott Waves Cyclical view: The advance from the recent low consist of multiple sequences of intraday impulsive 5 waves patterns (visible on minutes charts). Despite the recent failed (v)[green] wave within the last (i) [blue] wave, the previous bullish Elliott wave count remains intact .
The count on the chart below is consisted of multiple first and second waves which are typical for extended third of the third waves. If the count is valid then the lion part of the advance is yet to be seen. I see no reason to mention upside target for now, as, the 700 $ level along the Euro and Yen targets need to be challenged first.
Again, Forex and Metals traders should note the possibility that gold and silver can go up along a rising USD index. (See chart here)
Strategy: buy pullbacks as long as spot silver above 12.37$ and gold spot above 632$.
XAUUSD (spot gold) daily chart

Monday, May 21, 2007
Elliott Wave Principle
Dear readers,
Gold and silver caught some bids today and closed higher along a rising US dollar. Those of you who have been following my posts were certainly not surprised.
Some readers have emailed me with questions like: how do I make my gold price predictions (which are often very accurate) and what technical indicators I use for trading?
Well, I look at many different things: price & volume action, chart patterns, candle sticks, Fibonacci levels, moving averages, PPO, RSI, Stochastic, Inter market relationships, market sentiment and more. But above all cyclical analysis, namely Elliott wave analysis.
Elliott wave analysis is far from being a perfect tool (what is perfect?) However, as regards to making predictions Elliott waves counting when combined with other market indicators is the most valuable tool in my opinion.
Once you understand how the wave principal works, you will learn to respect the market opinion, you will stop looking for reasons to explain why the market is doing this or that. You will learn to accept the cyclical nature of waves.
One excellent book for learning wave analysis is: Elliott wave principle by Frost & Prechter.
By the way, I'm currently reading Prechter's latest book: How to Forecast Gold and Silver Using the Wave Principle. This 483 page book is an amazing documentary which aggregates all of the author gold and silver real time analysis between 1979 -2001.
I will post a more detailed review once I finish reading this book. For now I would just say that while Prechter is usually known for his bearish predictions, I was very surprised to read about some extremely bullish price objective for gold that might still be valid today.
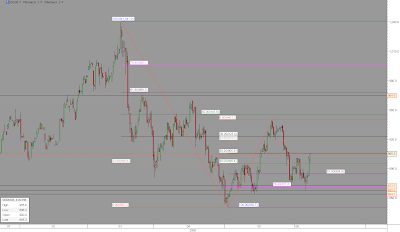
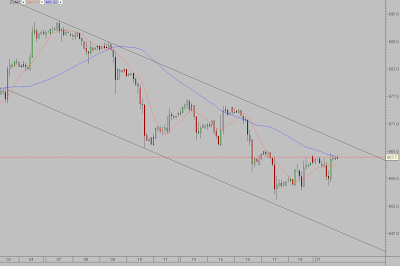
Short term technical update:
The price of gold is still inside the downtrend channel.
ZGM7 – CBOT June Gold Intraday (120 minutes) chart
Gold and silver caught some bids today and closed higher along a rising US dollar. Those of you who have been following my posts were certainly not surprised.
Some readers have emailed me with questions like: how do I make my gold price predictions (which are often very accurate) and what technical indicators I use for trading?
Well, I look at many different things: price & volume action, chart patterns, candle sticks, Fibonacci levels, moving averages, PPO, RSI, Stochastic, Inter market relationships, market sentiment and more. But above all cyclical analysis, namely Elliott wave analysis.
Elliott wave analysis is far from being a perfect tool (what is perfect?) However, as regards to making predictions Elliott waves counting when combined with other market indicators is the most valuable tool in my opinion.
Once you understand how the wave principal works, you will learn to respect the market opinion, you will stop looking for reasons to explain why the market is doing this or that. You will learn to accept the cyclical nature of waves.
One excellent book for learning wave analysis is: Elliott wave principle by Frost & Prechter.
By the way, I'm currently reading Prechter's latest book: How to Forecast Gold and Silver Using the Wave Principle. This 483 page book is an amazing documentary which aggregates all of the author gold and silver real time analysis between 1979 -2001.
I will post a more detailed review once I finish reading this book. For now I would just say that while Prechter is usually known for his bearish predictions, I was very surprised to read about some extremely bullish price objective for gold that might still be valid today.
Short term technical update:
The price of gold is still inside the downtrend channel.
ZGM7 – CBOT June Gold Intraday (120 minutes) chart

Friday, April 20, 2007
Five Interesting Blogs for the Weekend
- The Elliott Wave Lives ON – Excellent Elliott wave blog, S&P and GLD wave counts included.
-
JsMinset – Jim sinclair popular gold blog.
-
Well designed and informative - Grace Cheng Forex Blog.
-
Advanced XAU / GOLD Ratio Analysis at paint the charts.
-
Subscribe to:
Posts (Atom)
