


Speculators are making transactions which result in quick profit or loss plus commissions. Others buy gold with a long term strategy in mind. The supply demand equilibrium is presenting a case of itself.
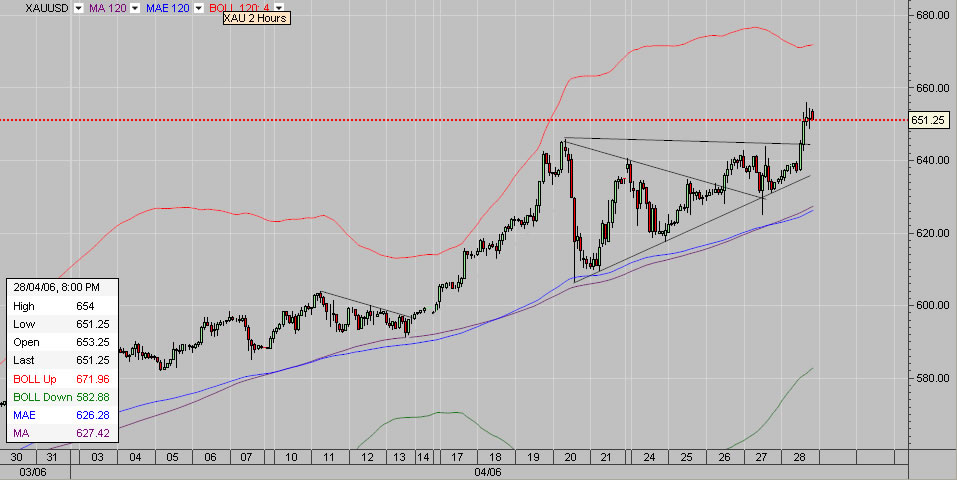
Technically, the intraday price range have gone as large as 40$ a day. The ascending triangle indicating a short term initial target of ~ 683$ per 1 gold troy ounce, the symmetrical triangle point to 671$ / 1 gold oz . Gold has gained 56% against the USD since the second Elliott wave started (41 weeks ago). The average positive return was 1.37% per week. If I extrapolate this data the new gold price target for 2006 is 939$.

See this post Gold Global Perspective: How high will gold go in 2006?
See Elliott wave tutorial

No comments:
Post a Comment