


Showing posts with label Yen. Show all posts
Showing posts with label Yen. Show all posts
Thursday, October 18, 2007
Gold Yen
Gold Yen indicates some kind of top (short or mid term) is around here so take note and be conservative with bearish USD speculation.

Monday, August 20, 2007
GGP Update
Dear readers,
In recent weeks the Dow Jones World Index had it's worst decline since 2002.
On the same page the VIX reached the highest point since 2003.

Given recent moves in major currencies (EURJPY 169 – 149, GBPJPY 251-219) gold have been as stable as one can expect from a major independent private currency. This is very encouraging to say the least. Odds still favors higher gold rates more then lower USD index.
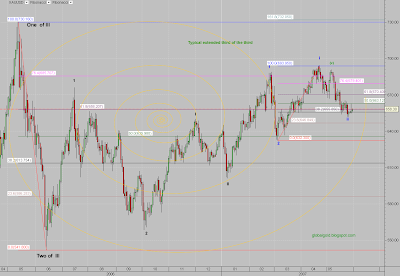
Gold daily chart annotated with wave count
Same 1-2 extending

Silver daily chart annotated with Elliott wave count
Retraced September 2006 – February 2007 secondary advance

In recent weeks the Dow Jones World Index had it's worst decline since 2002.
On the same page the VIX reached the highest point since 2003.
Given recent moves in major currencies (EURJPY 169 – 149, GBPJPY 251-219) gold have been as stable as one can expect from a major independent private currency. This is very encouraging to say the least. Odds still favors higher gold rates more then lower USD index.
Gold daily chart annotated with wave count
Same 1-2 extending

Silver daily chart annotated with Elliott wave count
Retraced September 2006 – February 2007 secondary advance

Sunday, July 22, 2007
Gold, USD & Forex Update
Dear readers,
The USD is looking oversold here and some bounce might be expected. If you add a channel the way I did, you can see that the USD index is at the bottom of the channel. In addition, the USD just tested the psychological important 80 level – this level was rarely violated, ever.
USD Index Daily Chart (note the deep oversold condition of RSI 14)

Try to avoid shorting the Yen as the crowed count this currency as a weak one. The interest rate on the yen is low and might continue to stay low for some time but the Japanese economy is not a weak economy in my book, not at all.
Particular vulnerable is the EURJPY pair which had already completed or might be very near to complete a seven years rally. A large correction is expected here – take note!
EURJPY Weekly Chart , Elliott wave count. (click to enlarge)

Gold and silver had a nice rally (as expected) but some significant resistance seen for both. on the other hand gold in terms of Yen and Euro made some advance so the move was not all USD related. If the USD will start strengthening as it might gold can correct some of its recent 47$ rally. Corrections should be seen as a buying opportunity and the June low should hold.
Spot Gold weekly chart annotated with Fibonacci levels. (click to enlarge)

The USD is looking oversold here and some bounce might be expected. If you add a channel the way I did, you can see that the USD index is at the bottom of the channel. In addition, the USD just tested the psychological important 80 level – this level was rarely violated, ever.
USD Index Daily Chart (note the deep oversold condition of RSI 14)
Try to avoid shorting the Yen as the crowed count this currency as a weak one. The interest rate on the yen is low and might continue to stay low for some time but the Japanese economy is not a weak economy in my book, not at all.
Particular vulnerable is the EURJPY pair which had already completed or might be very near to complete a seven years rally. A large correction is expected here – take note!
EURJPY Weekly Chart , Elliott wave count. (click to enlarge)

Gold and silver had a nice rally (as expected) but some significant resistance seen for both. on the other hand gold in terms of Yen and Euro made some advance so the move was not all USD related. If the USD will start strengthening as it might gold can correct some of its recent 47$ rally. Corrections should be seen as a buying opportunity and the June low should hold.
Spot Gold weekly chart annotated with Fibonacci levels. (click to enlarge)

Tuesday, July 17, 2007
Gold Market News
First Japanese gold ETF due to launch Aug. 10
source
As well as Small-Lot Gold Futures Trading on TOCOM(100 grams per lot , margin = 12,000 Yen)
source
Korea : The government plans to establish an exchange for gold as early as next year.
By Lee Hyo-sik
Staff Reporter
"The government plans to establish an exchange for gold as early as next year to make gold transactions more transparent and discourage the smuggling of the precious metal.
According to the Ministry of Finance and Economy, the government will set up an exchange, an organization to manage and supervise gold distribution, next year to stem any illegal transactions and distribution of gold.
It will expand the exchange into a comprehensive commodity exchange, like New York Mercantile Exchange (NYMEX), to deal with not only gold, but diamond, crude oil and other commodities as well.
The exchange will operate separately from the Korea Exchange (KRX) on which stocks, bonds and derivatives are traded, the ministry said."
source
source
As well as Small-Lot Gold Futures Trading on TOCOM(100 grams per lot , margin = 12,000 Yen)
source
Korea : The government plans to establish an exchange for gold as early as next year.
By Lee Hyo-sik
Staff Reporter
"The government plans to establish an exchange for gold as early as next year to make gold transactions more transparent and discourage the smuggling of the precious metal.
According to the Ministry of Finance and Economy, the government will set up an exchange, an organization to manage and supervise gold distribution, next year to stem any illegal transactions and distribution of gold.
It will expand the exchange into a comprehensive commodity exchange, like New York Mercantile Exchange (NYMEX), to deal with not only gold, but diamond, crude oil and other commodities as well.
The exchange will operate separately from the Korea Exchange (KRX) on which stocks, bonds and derivatives are traded, the ministry said."
source
Wednesday, July 11, 2007
Japan Should Diversify Reserves
Markets normally lead the press…
Japan Should Diversify Reserves, Abe Adviser Ito Says
By Shigeki Nozawa
July 11 (Bloomberg) -- Japan, the largest overseas holder of U.S. Treasuries, should invest $700 billion of its currency reserves in higher-yielding assets such as stocks and corporate bonds, said Takatoshi Ito, an adviser to the prime minister.
The reserves should be managed by a special fund that will gradually diversify into euros, Australian dollars and emerging- market currencies, Ito said in an interview in Tokyo.
Central banks in South Korea, China and Taiwan have announced plans to buy assets with higher returns than U.S. debt, contributing to a 7.4 percent drop in the dollar against the euro in the past year. -source
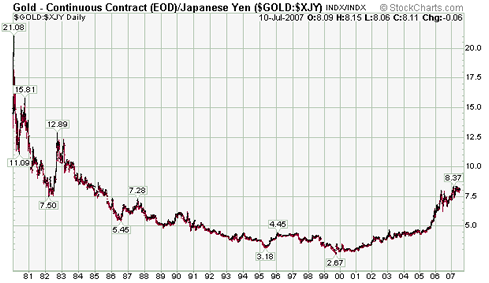
Long term 27 years Gold / Yen Chart (XAUJPY) Price scale : 10K Yen per Gold Troy Ounce.
Japan Should Diversify Reserves, Abe Adviser Ito Says
By Shigeki Nozawa
July 11 (Bloomberg) -- Japan, the largest overseas holder of U.S. Treasuries, should invest $700 billion of its currency reserves in higher-yielding assets such as stocks and corporate bonds, said Takatoshi Ito, an adviser to the prime minister.
The reserves should be managed by a special fund that will gradually diversify into euros, Australian dollars and emerging- market currencies, Ito said in an interview in Tokyo.
Central banks in South Korea, China and Taiwan have announced plans to buy assets with higher returns than U.S. debt, contributing to a 7.4 percent drop in the dollar against the euro in the past year. -source
Long term 27 years Gold / Yen Chart (XAUJPY) Price scale : 10K Yen per Gold Troy Ounce.
Tuesday, July 10, 2007
XAU, XAG & Forex Commentary
Not much change in the USD price of gold (xauusd) today. Gold futures traded and closed slightly higher but priced in Euro and Yen gold is actually down today.
The Euro made a new all time high vs. the USD, EURUSD ~= 1.3740. Note that pre issued Euro high was EURUSD 1.4750, Long term (30 years) retro perspective EUR/USD chart.
Marginal carry traders capitulated as the Yen rallied strongly. Be careful with that one! , Seems like the carry trade become way over crowded as every one and his dog doing the thing.
Silver up, the high of the day was 13.085 for SIU7 (COMEX September contract)
Silver SIU7 Intraday Chart (2 hours sticks)

Wednesday, May 30, 2007
XAUUSD Waves Update
Dear readers,
Gold have probably bottomed and in time will be headed higher to challenge recent highs at 700 U$D / 520 € / 83,000 ¥. Silver confirms this assumption and the silver /gold ratio shows relative strength.
Elliott Waves Cyclical view: The advance from the recent low consist of multiple sequences of intraday impulsive 5 waves patterns (visible on minutes charts). Despite the recent failed (v)[green] wave within the last (i) [blue] wave, the previous bullish Elliott wave count remains intact .
The count on the chart below is consisted of multiple first and second waves which are typical for extended third of the third waves. If the count is valid then the lion part of the advance is yet to be seen. I see no reason to mention upside target for now, as, the 700 $ level along the Euro and Yen targets need to be challenged first.
Again, Forex and Metals traders should note the possibility that gold and silver can go up along a rising USD index. (See chart here)
Strategy: buy pullbacks as long as spot silver above 12.37$ and gold spot above 632$.
XAUUSD (spot gold) daily chart

Tuesday, March 13, 2007
¥ Japanese Yen Long Term Chart Analysis
The Yen Is a hot topic lately and so called "Experts" decided that the Yen is to be blamed for the recent volatility hiccup of the global markets. Well, it is true that gold in term of yen made a new 20 plus year high just recently whereas in terms of USD and Euro it did not. This fact might be important to remember.
As for the USD/JPY pair?
Let's put aside the carry trade and interest rates and look at the charts.
From the 30 years chart we can learn that the Yen bottomed / USD topped at 1982 some 25 years ago! Back then 1 USD was worth about 277 Yen. Between 1982 and 1995 the USD declined to about 79 Yen for a loss of about 71%. Note that the 13 years decline was done in a three wave pattern. According to my count the USD/JPY is currently in wave (iii) and headed higher then 135 – wave (i). If you need a basic wave guide I highly recommend that you use this free Elliott wave tutorial.
Note that the 50 month MA is as stable as ever and volatility is relatively low for the last decade as the pair still trades between the 1995 low and the 1998 high. The USDJPY pair might be breaking up from a long term symmetrical triangle.
30 Years USDJPY Chart.

Japanese Yen / US Dollar 1994 - 2007

As for the USD/JPY pair?
Let's put aside the carry trade and interest rates and look at the charts.
From the 30 years chart we can learn that the Yen bottomed / USD topped at 1982 some 25 years ago! Back then 1 USD was worth about 277 Yen. Between 1982 and 1995 the USD declined to about 79 Yen for a loss of about 71%. Note that the 13 years decline was done in a three wave pattern. According to my count the USD/JPY is currently in wave (iii) and headed higher then 135 – wave (i). If you need a basic wave guide I highly recommend that you use this free Elliott wave tutorial.
Note that the 50 month MA is as stable as ever and volatility is relatively low for the last decade as the pair still trades between the 1995 low and the 1998 high. The USDJPY pair might be breaking up from a long term symmetrical triangle.
30 Years USDJPY Chart.
Japanese Yen / US Dollar 1994 - 2007
Monday, February 12, 2007
Spot Gold Commentary
Dear readers,
Gold in terms of yen have made a new multi years high (See the long term gold/yen chart below).
Other then this I would like to repeat several points:
As the great global gold bull market continues expect the price of gold to be more effecting for other market prices and less effected by them. Expect more gold products. Most importantly – Volatility will rise from time to time both on the upside and the downside.
That’s all for now, as time permits I will make my best to keep this gold blog up to date. If you are interested in gold and the factors that determine its price I advice that you search this blog archive which goes back to late 2005 and Includes many links for other free online resources.

Tuesday, December 05, 2006
Gold in Euro and Yen
Dear readers,
Don’t be surprised to see Higher USD Index along Higher Gold price.
See also : HUI Breakout
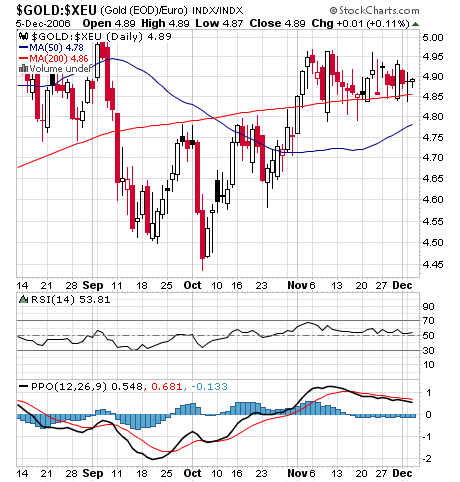
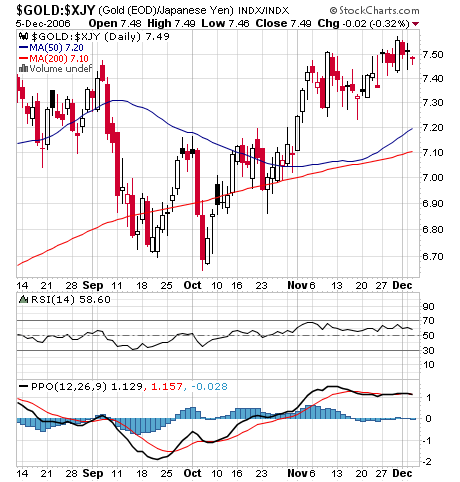
Below are daily charts of Gold in Euro and Gold in Yen, can you see the inverted head and shoulders patterns?
Don’t be surprised to see Higher USD Index along Higher Gold price.
See also : HUI Breakout
Below are daily charts of Gold in Euro and Gold in Yen, can you see the inverted head and shoulders patterns?


Tuesday, October 10, 2006
Gold / Euro / Yen
Dear readers,
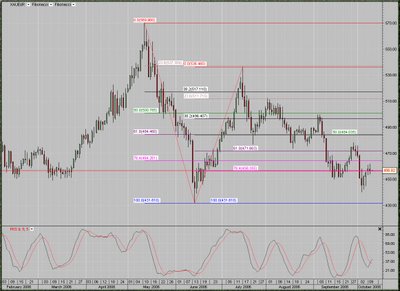
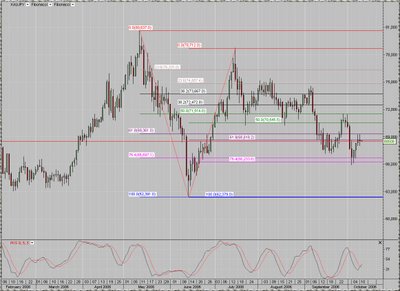
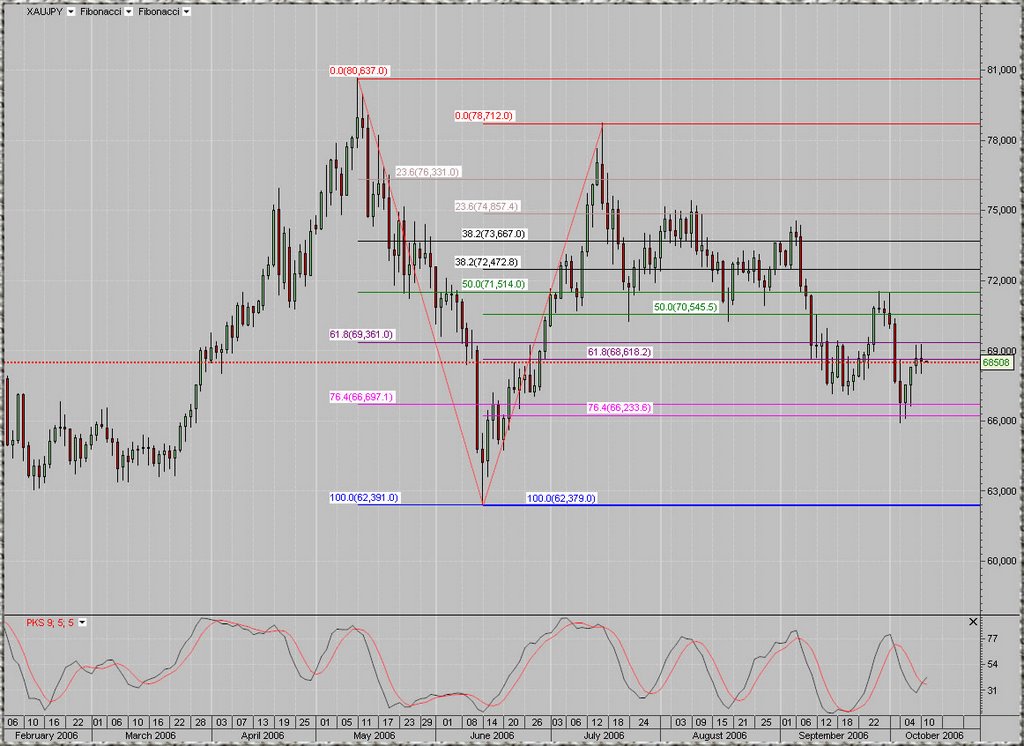
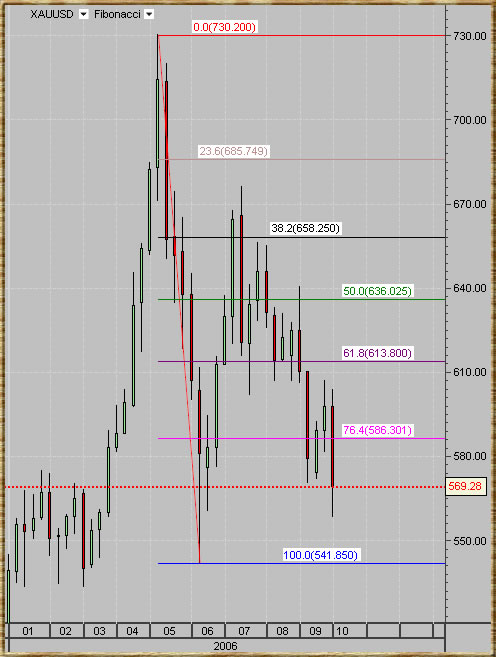
I'm posting Gold/Euro and Gold/Yen Fibonacci charts for your reference, notice the stochastic crossover.
click on the charts for larger view.
I'm posting Gold/Euro and Gold/Yen Fibonacci charts for your reference, notice the stochastic crossover.
click on the charts for larger view.

Wednesday, October 04, 2006
Gold ($, €, ¥) weekly charts
Some of the latest gold market news from around the world:
Singapore gold fund trading starts next week
SINGAPORE, Oct 5 (Reuters) - StreetTRACKS Gold Shares (GLD.N: Quote, Profile, Research), the world's largest gold exchange-traded fund, would be cross-listed in Singapore next week in a move to capitalise on Asia's growing fondness for bullion.
It will be listed on Oct. 11 on the Singapore Exchange and would be Asia's first gold-based ETF.
StreetTRACK is the World Gold Council's New York Stock Exchange-listed product, with an average daily volume of around $400 million and assets in excess of $7 billion.-source
Official Statistics Confound Rumour of Heavy Central Bank Sales: CBGA Sales in Year 2 Confirmed as Well Under Quota at 393 Tonnes
As forecast in mid-September’s Gold Survey Update 1, sales by the signatories to the Central Bank Gold Agreement (CBGA) ended up far short of their annual 500 tonne quota at just 393 tonnes. This confounds market speculation during much of September that there had been a last minute rush to sell gold before the end of the second Agreement year (on 26th September) and that this was responsible for the period’s price weakness. -source
Riksbank reallocates gold and foreign currency reserves
The Riksbank intends to sell up to 10 tonnes of the gold reserve during the period 27 September 2006 to 26 September 2007. The sale is in compliance with the Central Bank Gold Agreement (CBGA) which was signed by 15 European central banks and came into force on 27 September 2004. The agreement, which runs for five years, enables the Riksbank to sell up to 60 tonnes of gold during this period. To date the Riksbank has sold a total of 25 tonnes of gold, 15 tonnes during the first year of the agreement and 10 tonnes during the second year. The Riksbank’s gold reserve currently amounts to 160 tonnes of gold.-source
CBOT 100 oz Gold Futures Surpass 60% Market Share
CBOT Full-sized Gold Futures Contract Surpass 60 percent Market Share for the First Time in a Single Trading Day
CBOT Full-sized Silver Futures achieves 10,000 contracts in open interest
CHICAGO October 4, 2006 The Chicago Board of Trade (CBOT) announced today that its Full-sized (100 oz.) Gold futures contract surpassed a market share milestone of
60 percent on October 2, capturing 64 percent of all listed Gold futures traded in North America that day. Open interest in the CBOT Full-sized (5,000 oz.) Silver futures grew beyond 10,000 contracts and set a new record of 10,064 contracts yesterday. The previous record was 9,959 contracts set on September 29, 2006.
Average daily volume in the CBOT Gold complex, consisting of Full-sized (100 oz.) Gold futures and options and mini-sized (33 oz.) Gold futures contracts, reached
52,464 contracts during September and achieved a market share of 54 percent of all Gold futures traded in North America for the month. -source
iShares Silver
BARCLAYS Global Investors has applied to register 15.2 million new shares in its iShares Silver Trust on AMEX doubling the total amount that could be invested, Reuters reported.
"We are registering additional shares. That does not mean the trust is automatically going to buy additional metal," Barclays spokeswoman Christine Hudacko told Reuters.-source
Year to date weekly charts of gold in terms of USD, Euro & Yen.


Monday, August 07, 2006
Gold / ($, €, ¥) & Silver – Charts
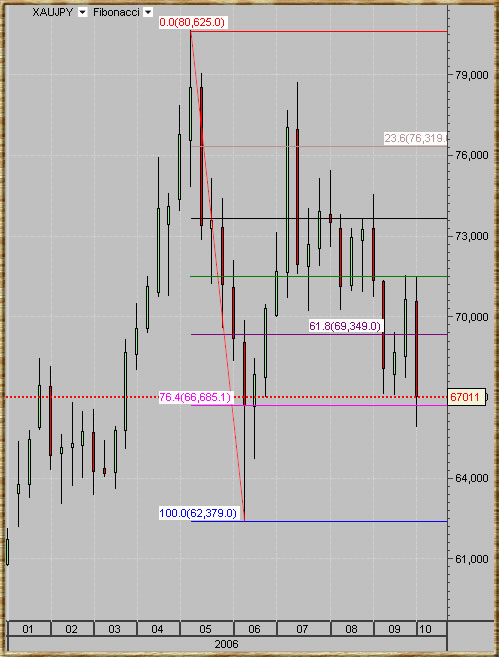
The gold market has been pretty boring the last few trading days. Gold is stuck in a relatively tight trading range (638$ - 656$) – see the first gold chart below.
Looking at the 3 month gold charts – gold formed a triangle pattern which is not yet completed. The pattern is similar for Gold/USD, Gold/Euro and Gold/Yen. Silver already broke above its diagonal resistance and consolidates around the 50% Fibonacci line (~12.30$).
It is quiet possible that gold will continue to consolidate around current levels (638$ - 656$) further consolidation is also possible and gold can go as low as 620's (not likely). IF gold can break above the diagonal resistance line, that will ignite a serious rally (I think it can).
As of now, nothing more to report other then:
CBOT (August 4, 2006) system failure - link
China's silver consumption triples
(Xinhua)Updated: 2006-08-07 16:20
China consumed 2,600 tons of silver in 2005, nearly three times the volume of twenty years ago, said sources with the Gemological Association of China.
But the country exports even more than it consumes. With an all-time record production of 7,196 tons of silver in 2005, China has become the world's third biggest silver supplier.
Exports of silver rose to 4000 tons in 2006, up by a third from the 3050 tons notched up in 2004.
Consumption at home surged 190 percent to 2600 tons in 2005 from a modest 900 tons in 1985. Despite the constant fluctuations in the prices of gold and silver on the international market, China's silver consumption has continued to grow steadily in recent years, said the association.-link.
See also:
Gold and Silver Stocks
Commodities Charts
Click on the charts below for enlarged view:
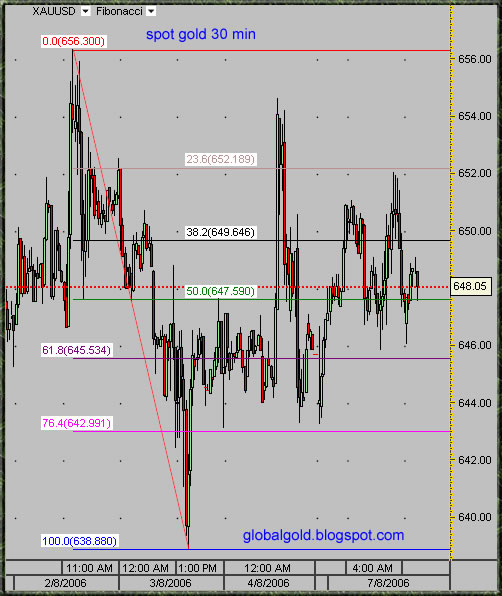
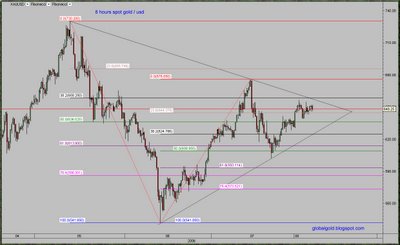
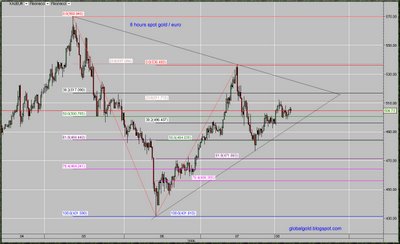


Sunday, July 23, 2006
Gold/$, Gold/€ & Gold/¥ - Charts and Commentary
Dear readers,
The news which directly or indirectly related to gold are usually subjective and often causing exactly the opposite from what is assumed to be logical (sell the news syndrome). Technicals on the other hand are objective, at least when viewed from numeric perspective.
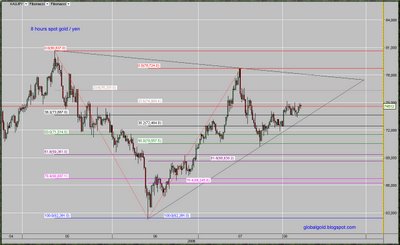
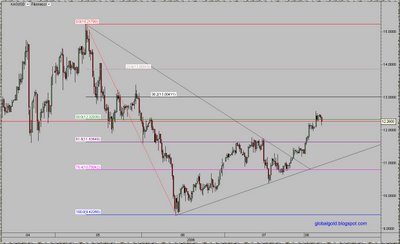
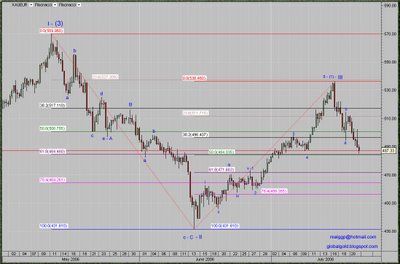
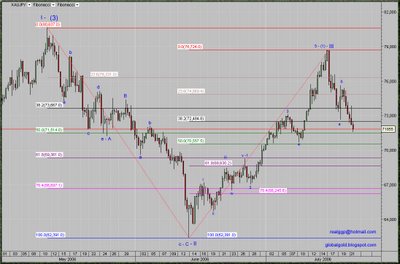
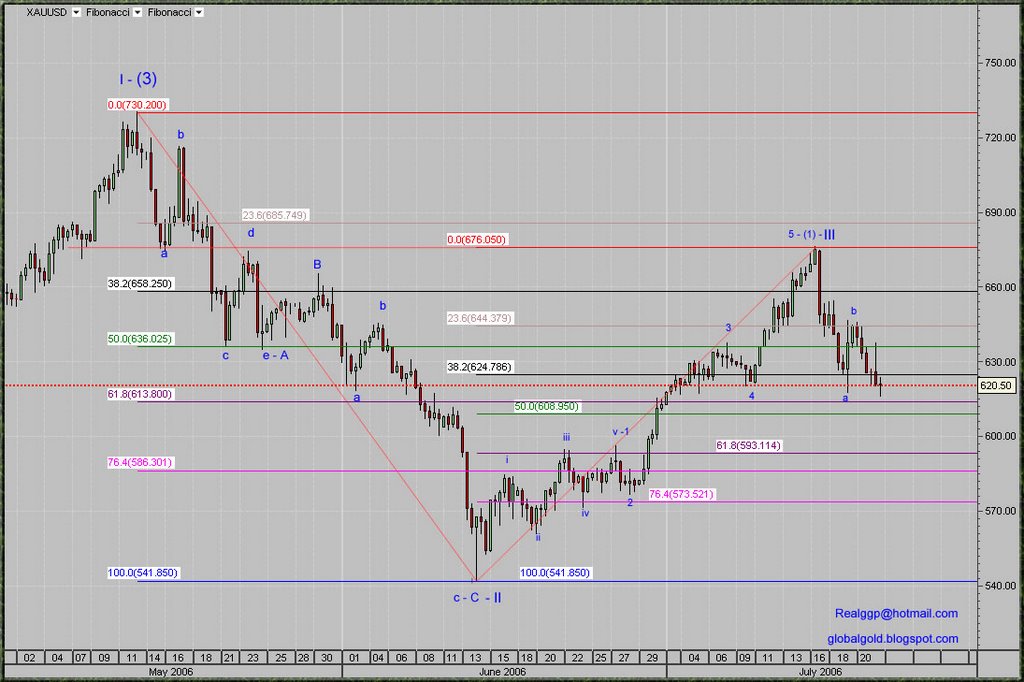
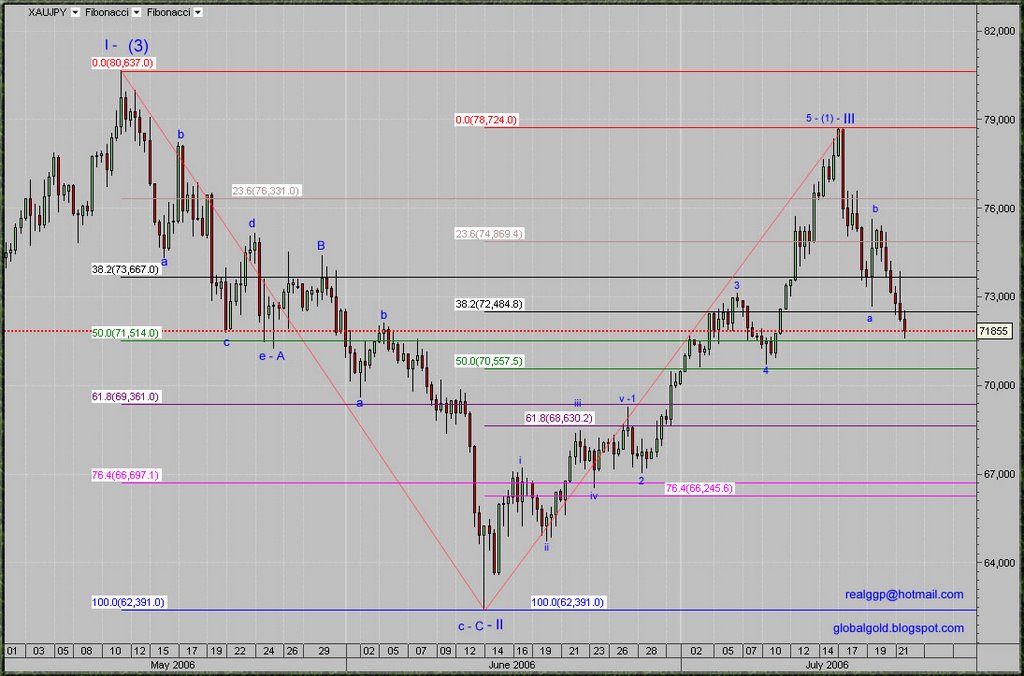
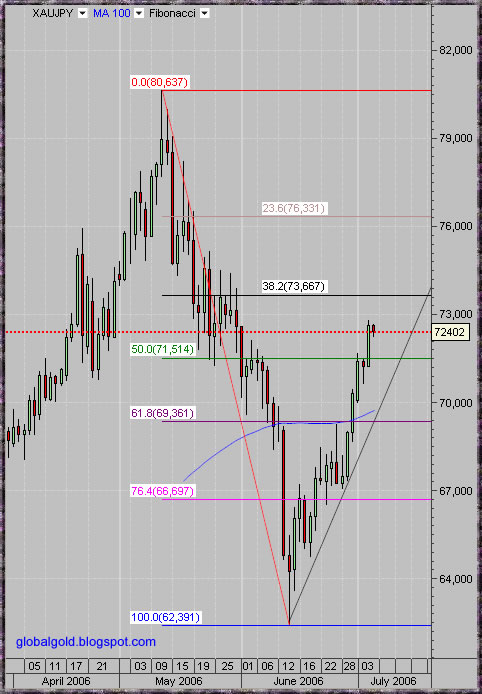
I have prepared three intraday gold charts covering the short term history of Gold/$, Gold/€ & Gold/¥ exchange rates. I added two sets of Fibonacci retracement lines, top to bottom and bottom to top. All three charts are annotated with the same Elliott wave count, high correlation is easily recognized. The pattern similarity between all three charts is indicating that gold is becoming more independent, market factors which used to affect the price of gold (USD index, Euro, Crude Oil. Etc.) are loosing significance. The gold market is evolving to be more mature, the price of gold will be affected by gold market internal forces more then anything else – this is the trend in my opinion. As time goes by and as this great global gold bull market develops, I expect gold influence to grow while gold as a monetary object will be less affected and possibly much less affected by other market variables. Gold and Forex traders should closely observe this development; things that worked in the past might not work in the Future
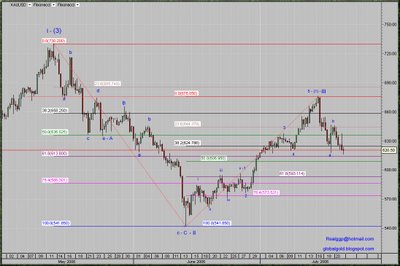
Gold is completing or already completed its wave (2) – III correction which should be immediately followed by volatile upward movement – wave (3) – III.
I'm repeating the suggested short term bottom target for Gold/$: 613$, 608$ & 593$.
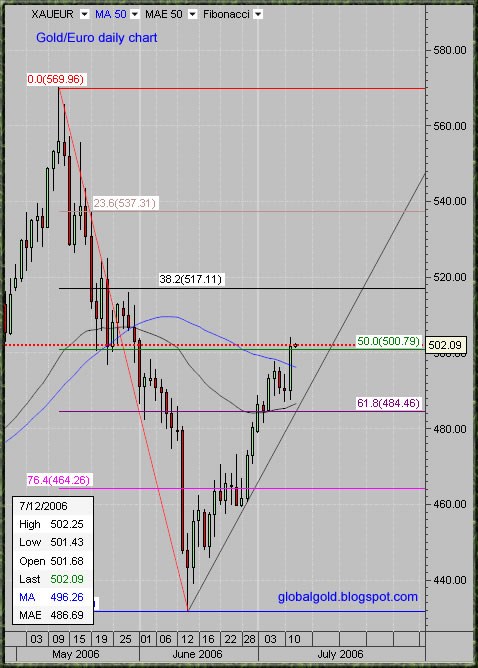
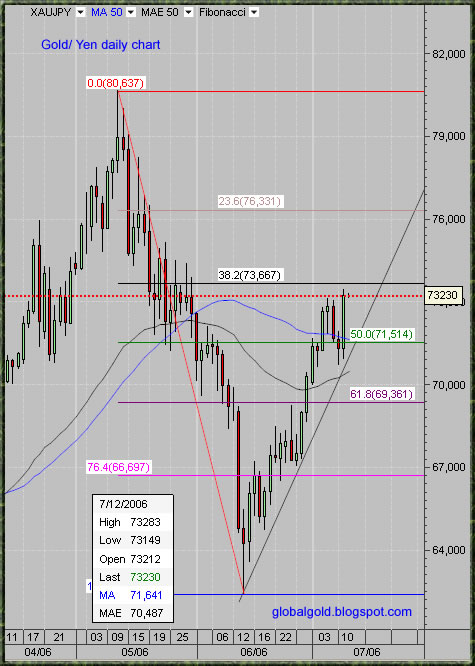
And adding suggested target for Gold/€: 484€ & 471€ and targets for Gold/¥: 71,514¥, 69,361¥ & 68,630¥.
Click on the charts below for better view.
Related:
Gold and Silver Stocks
For basic Elliott Wave Tutorial see EWI (needs free registration)
The news which directly or indirectly related to gold are usually subjective and often causing exactly the opposite from what is assumed to be logical (sell the news syndrome). Technicals on the other hand are objective, at least when viewed from numeric perspective.
I have prepared three intraday gold charts covering the short term history of Gold/$, Gold/€ & Gold/¥ exchange rates. I added two sets of Fibonacci retracement lines, top to bottom and bottom to top. All three charts are annotated with the same Elliott wave count, high correlation is easily recognized. The pattern similarity between all three charts is indicating that gold is becoming more independent, market factors which used to affect the price of gold (USD index, Euro, Crude Oil. Etc.) are loosing significance. The gold market is evolving to be more mature, the price of gold will be affected by gold market internal forces more then anything else – this is the trend in my opinion. As time goes by and as this great global gold bull market develops, I expect gold influence to grow while gold as a monetary object will be less affected and possibly much less affected by other market variables. Gold and Forex traders should closely observe this development; things that worked in the past might not work in the Future
Gold is completing or already completed its wave (2) – III correction which should be immediately followed by volatile upward movement – wave (3) – III.
I'm repeating the suggested short term bottom target for Gold/$: 613$, 608$ & 593$.
And adding suggested target for Gold/€: 484€ & 471€ and targets for Gold/¥: 71,514¥, 69,361¥ & 68,630¥.
Click on the charts below for better view.

Related:
Gold and Silver Stocks
For basic Elliott Wave Tutorial see EWI (needs free registration)
Wednesday, July 12, 2006
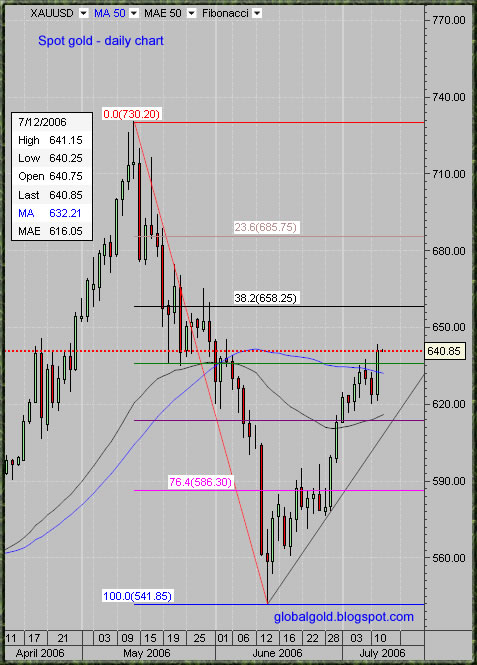
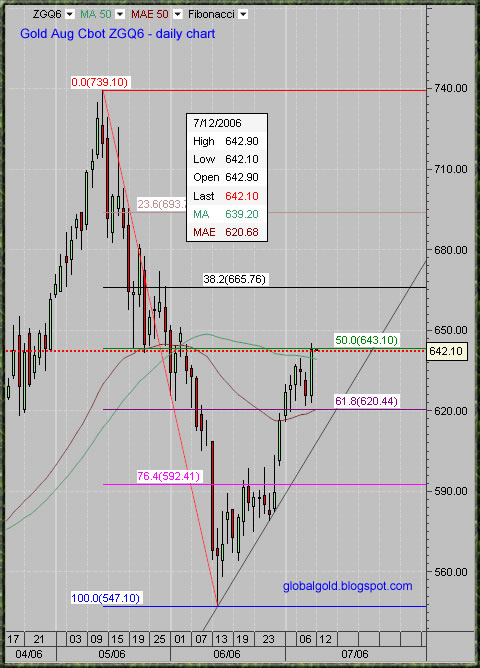
Gold Chart and Commentary
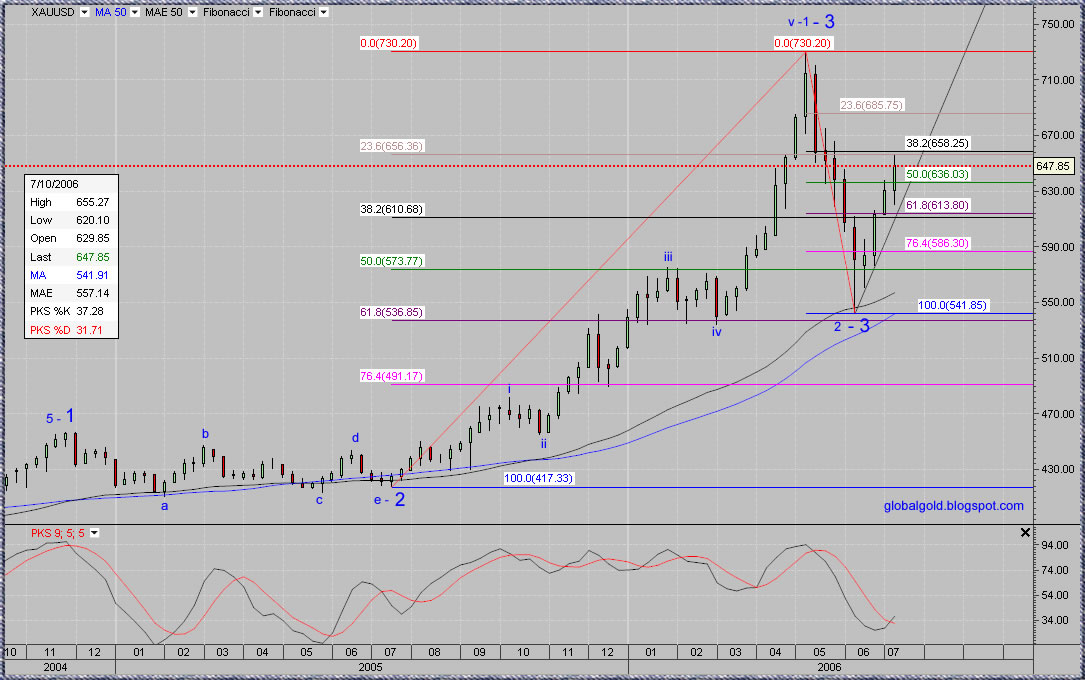
Gold encountered relatively strong resistance area at 656$ -658$ for the spot dollar price (38.2% Fib on the short set & 23.6% Fib on the long set –weekly chart). That’s along the relevant Fibs on GOLD/EURO & GOLD/YEN (yesterday charts). The price of gold pulled back sharply as smart traders took profits at the zone of resistance taking advantage of the hype regarding so called International tensions.
As I said before the price of gold is directly affected by pure economic and monetary factors. International tensions and terror events are not directly related to the price of gold. It's the psychology they might manufacture which can affect the short term price action. Correlated events like in India and the Middle East should be seen as a short term opportunity for profit taking when the technicals confirm.
Nevertheless, this is the Great Global Gold Bull Market and holding a long term core gold positions is a smart thing to do as timing the 24 hours gold market is extremely difficult. This is the third primary Elliott wave and as such it should be highly impulsive and extensive. The current Elliott wave is quiet complex and the outlook is bullish.
Short term 30 min chart showing this week action, minor Elliott wave count suggest a completion of impulsive wave then a counter impulsive correction (a) to the 38.2% Fib. Given the resistance at 5 (see weekly chart below) the odds favor further consolidation (c bottom) before moving higher. Traders should be patient at this point and wait for short term buying opportunity, all bets are off if the price of gold goes above 655$ – 658$ - watch out for head fakes !
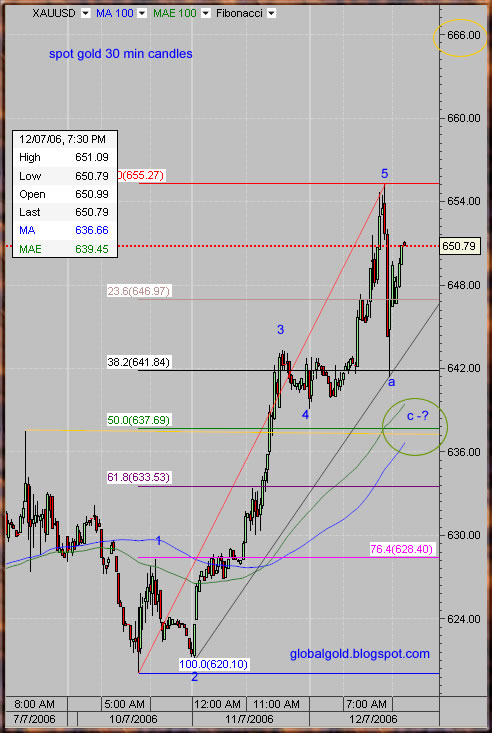
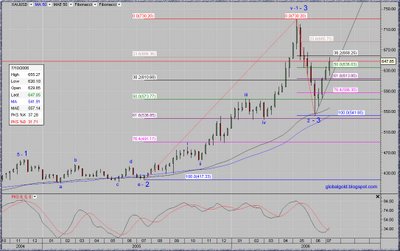
Below is the Weekly chart annotated with the wave count for the past 2 years – currently Wave 3 of 3. Click on the chart to enlarge:
As I said before the price of gold is directly affected by pure economic and monetary factors. International tensions and terror events are not directly related to the price of gold. It's the psychology they might manufacture which can affect the short term price action. Correlated events like in India and the Middle East should be seen as a short term opportunity for profit taking when the technicals confirm.
Nevertheless, this is the Great Global Gold Bull Market and holding a long term core gold positions is a smart thing to do as timing the 24 hours gold market is extremely difficult. This is the third primary Elliott wave and as such it should be highly impulsive and extensive. The current Elliott wave is quiet complex and the outlook is bullish.
Short term 30 min chart showing this week action, minor Elliott wave count suggest a completion of impulsive wave then a counter impulsive correction (a) to the 38.2% Fib. Given the resistance at 5 (see weekly chart below) the odds favor further consolidation (c bottom) before moving higher. Traders should be patient at this point and wait for short term buying opportunity, all bets are off if the price of gold goes above 655$ – 658$ - watch out for head fakes !

Below is the Weekly chart annotated with the wave count for the past 2 years – currently Wave 3 of 3. Click on the chart to enlarge:
Tuesday, July 11, 2006
Gold , Silver , Forex - chart update
First I want to offer my condolences for Indian readers who suffered horrifying terror event at the city of Bombay.
In the short term the technicals rule the price of gold. Gold was due for a bounce with or without the Bombay event (see yesterday chart).
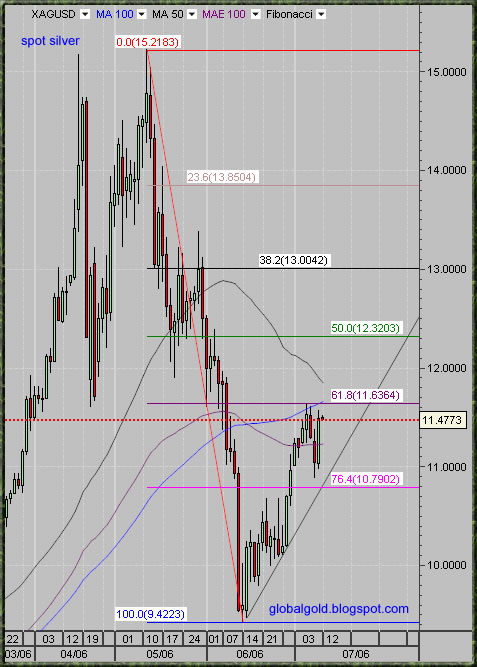
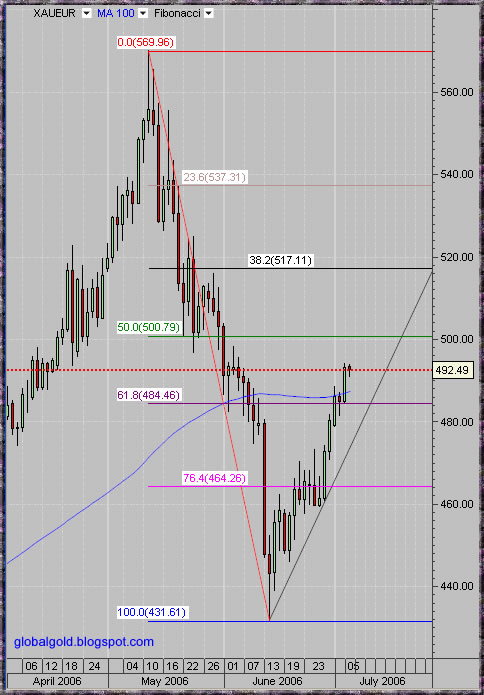
The Aug gold future contract managed to close above its 50 DMA but is currently still struggling with the 50% Fib line. Spot gold did cross its 50 DMA as well as the 50% Fib line. Gold/Euro is back above 500 Euro, above the 50 DMA and above the 50% Fib. Gold/YEN is looking the most bullish, well above the 50 DMA and just below the 38.2% Fib. Gold/Silver ratio = ~55.64, Gold/Oil ratio =~8.64, Dow/Gold ratio =~17.38. Silver continue to lag behind - still below the 61.8% Fib and the 100 DMA.
Fib lines above the current price are resistance and Fibs below are support, the same goes for moving averages(see charts below).
Zimbabwe: RBZ Eyes Gold Mine
THE Reserve Bank of Zimbabwe is reportedly eyeing a controlling stake in Globe and Phoenix Mine in a desperate bid to improve Zimbabwe's dwindling foreign currency reserves.
Sources told this paper that the Kwekwe-based gold mine was one of the projects that the Central Bank was eyeing with monetary authorities already having begun talks with unnamed horticultural producers for possible acquisitions. -source
By the way, anyone can copy my charts but please provide link and mention the source.
EWI are kind to offer free week(12 -19 July) of : Intraday Forecasts of US Stocks and EWI Financial Forecast Service- this service usually cost 6000$ a year , so this is a 115$ Free trail – check it out –( you only need to provide email and user name)
In the short term the technicals rule the price of gold. Gold was due for a bounce with or without the Bombay event (see yesterday chart).
The Aug gold future contract managed to close above its 50 DMA but is currently still struggling with the 50% Fib line. Spot gold did cross its 50 DMA as well as the 50% Fib line. Gold/Euro is back above 500 Euro, above the 50 DMA and above the 50% Fib. Gold/YEN is looking the most bullish, well above the 50 DMA and just below the 38.2% Fib. Gold/Silver ratio = ~55.64, Gold/Oil ratio =~8.64, Dow/Gold ratio =~17.38. Silver continue to lag behind - still below the 61.8% Fib and the 100 DMA.
Fib lines above the current price are resistance and Fibs below are support, the same goes for moving averages(see charts below).
Zimbabwe: RBZ Eyes Gold Mine
THE Reserve Bank of Zimbabwe is reportedly eyeing a controlling stake in Globe and Phoenix Mine in a desperate bid to improve Zimbabwe's dwindling foreign currency reserves.
Sources told this paper that the Kwekwe-based gold mine was one of the projects that the Central Bank was eyeing with monetary authorities already having begun talks with unnamed horticultural producers for possible acquisitions. -source
By the way, anyone can copy my charts but please provide link and mention the source.
EWI are kind to offer free week(12 -19 July) of : Intraday Forecasts of US Stocks and EWI Financial Forecast Service- this service usually cost 6000$ a year , so this is a 115$ Free trail – check it out –( you only need to provide email and user name)


Wednesday, July 05, 2006
GOLD / EURO / YEN
Technically - Not much change from yesterday. Offline and online forex traders should take a deep look at these charts:
See: Gold and Silver stocks - chart reviews


See: Gold and Silver stocks - chart reviews
Friday, April 14, 2006
Gold vs. X
There are numerous press release, short recommendation, publication and observation which are all stating a bearish view toward the USD. I am well aware of the arguments which imply that the USD should head lower vs. other national currencies and there is no need to mention them. But, as I already discussed in several previous posts, the Forex market seems to be well managed toward stability.
Here is a performance comparison 200 day chart between several popular national currencies, Gold, Silver and OIL. Looking at the chart it is very easy to notice that almost all national currencies are actually down to unchanged against the USD (200 days time frame) the exceptions are the South African Rand (ZAR) and the Canadian Dollar – both are gold, silver & commodity rich nations.
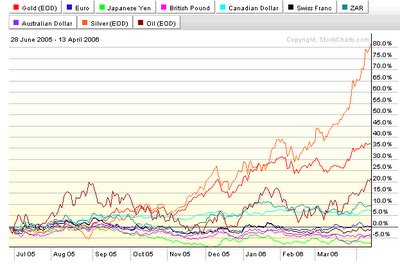
The conclusion is this: Under current market conditions it is a possibility that the USD will continue to stay relatively unchanged vs. other national currencies. Regardless of the country you are living in, gold and silver savings have been profitable the last 200 days. Investors who look for currency diversification should look at gold (with a glance of silver) and ignore the minor fluctuation in the Forex market.
Here is a performance comparison 200 day chart between several popular national currencies, Gold, Silver and OIL. Looking at the chart it is very easy to notice that almost all national currencies are actually down to unchanged against the USD (200 days time frame) the exceptions are the South African Rand (ZAR) and the Canadian Dollar – both are gold, silver & commodity rich nations.
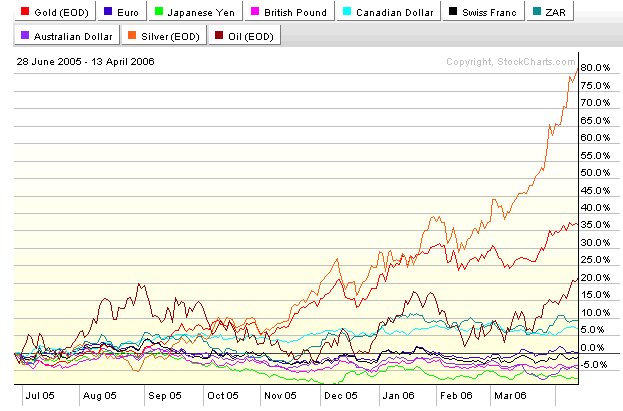
The conclusion is this: Under current market conditions it is a possibility that the USD will continue to stay relatively unchanged vs. other national currencies. Regardless of the country you are living in, gold and silver savings have been profitable the last 200 days. Investors who look for currency diversification should look at gold (with a glance of silver) and ignore the minor fluctuation in the Forex market.
Friday, April 07, 2006
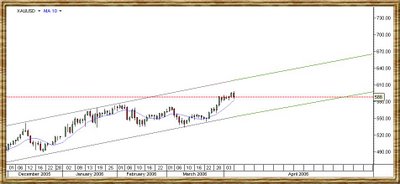
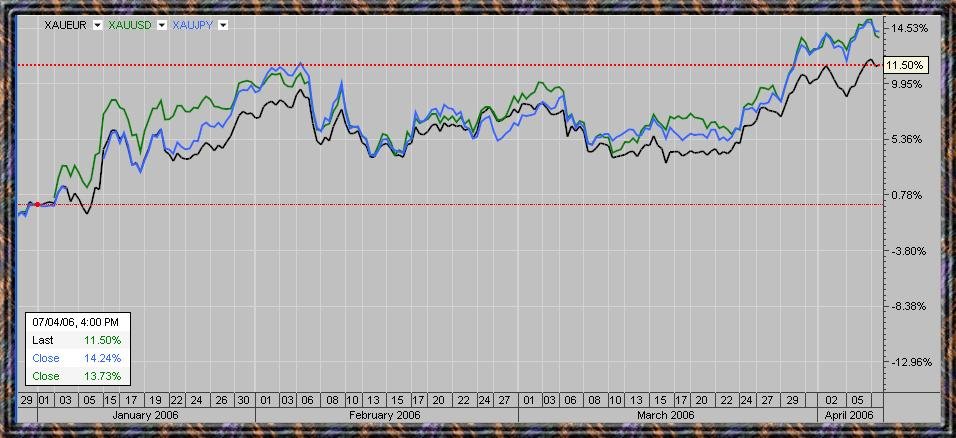
Gold / $, Gold / € & Gold / ¥ Correlation
I haven't noticed any interesting or important news which are directly related to the gold and silver markets. Just the usual Silver ETF hype, Inflation deflation debates, Commodity bull cycle, Debts and Interest rates & the usual gossip.
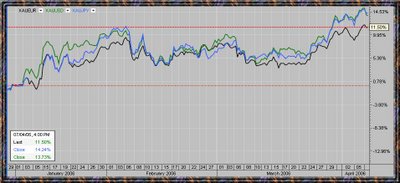
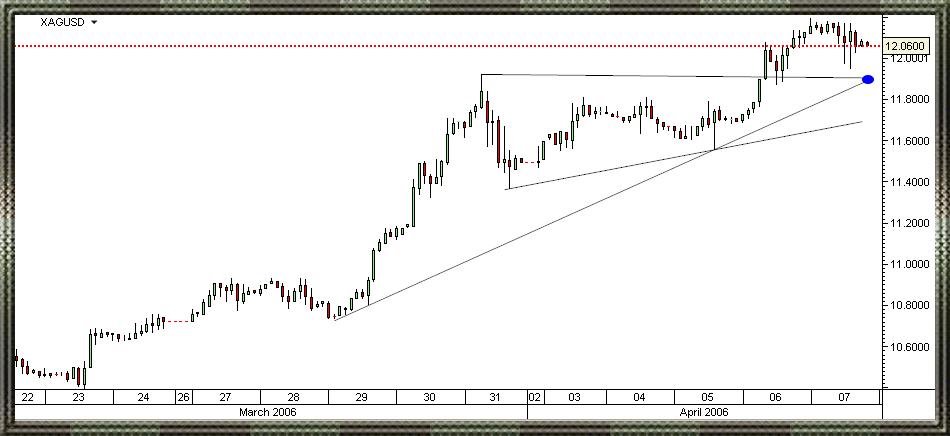
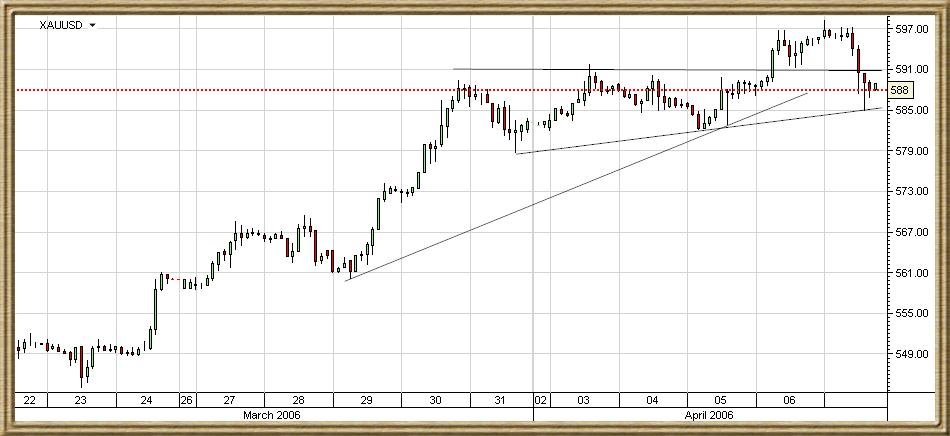
Since Jan 01 2006 Gold is up against the Euro (€) ~ 11.50% , up against the USD ($) ~ 13.74% & up Against the Yen(¥) 14.24%
The gold silver ratio (XAU/XAG) = ~ 48.75, Dow / Gold = ~18.91, Gold / Crude oil = ~8.72.
Gold in terms of EURO, USD & YEN is showing pretty good correlation.
2 hours intraday spot silver chart
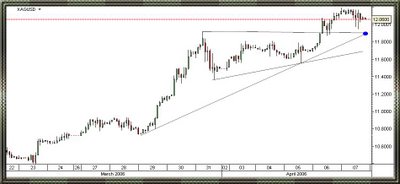
2 hours intraday spot gold chart
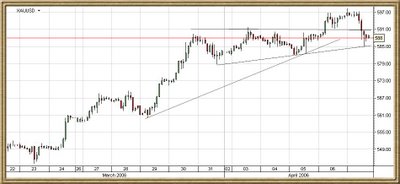
Gold channel chart
Since Jan 01 2006 Gold is up against the Euro (€) ~ 11.50% , up against the USD ($) ~ 13.74% & up Against the Yen(¥) 14.24%
The gold silver ratio (XAU/XAG) = ~ 48.75, Dow / Gold = ~18.91, Gold / Crude oil = ~8.72.
Gold in terms of EURO, USD & YEN is showing pretty good correlation.
2 hours intraday spot silver chart
2 hours intraday spot gold chart
Gold channel chart

Wednesday, March 29, 2006
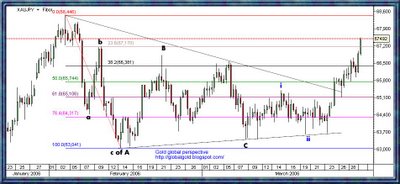
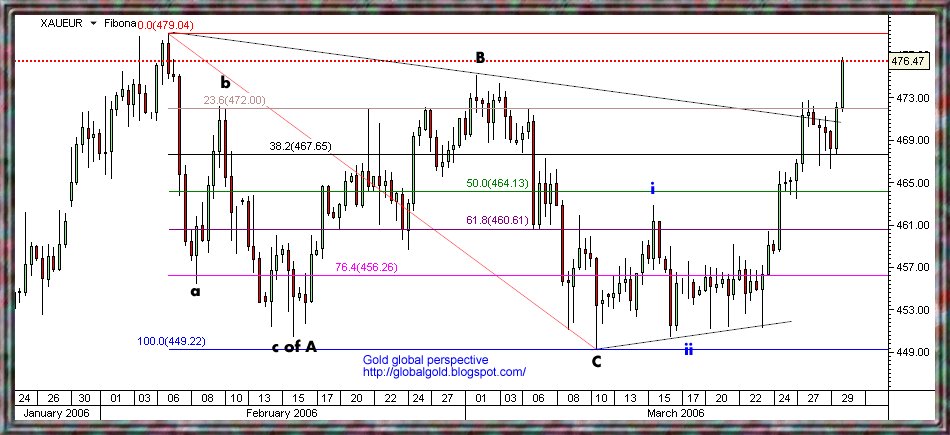
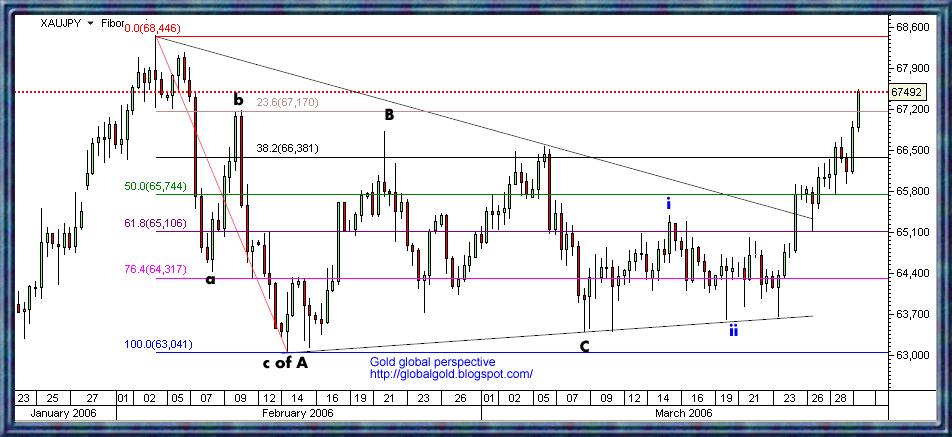
Gold , $ , € , ¥ & Silver
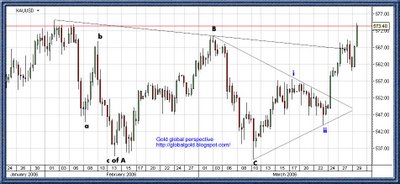
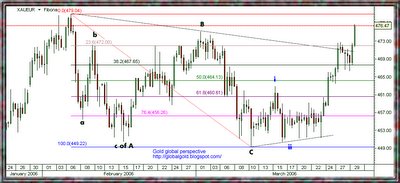
Gold broke up against the upper diagonal downtrend line, in addition it now trades above the { B }high. Gold in terms of USD, EURO & YEN is trading in a correlated fashion. Silver continue to go higher making new multi years day after day (long term silver charts).
gold and silver stocks reviews
Click on the charts below to enlarge
gold and silver stocks reviews
Click on the charts below to enlarge

Subscribe to:
Posts (Atom)
