


Total OTC derivatives are up from ~414 trillion to ~516 trillion for notional amounts outstanding (+24.6%) and up from 9.682 trillion to 11.140 trillion at gross market values (+15%).
Gold OTC derivatives are actually down from 0.640 trillion to 0.426 trillion for notional amounts outstanding (-33.4%) and from 56 billion to 47 billion at gross market values (-16%).
Gold OTC derivatives are still just a tiny part of total OTC derivatives (less then 0.1% for notional value and a~0.42% at gross market values)
The decline of gold OTC derivatives is probably a direct result of:
1) De-Hedging by gold producers.
2) Market participants move their business from OTC derivatives into more liquid, transparent and regulated markets such as COMEX (GC) and CBOT (ZG).
You can see the BIS OTC derivatives report here
Showing posts with label OTC derivatives. Show all posts
Showing posts with label OTC derivatives. Show all posts
Tuesday, December 25, 2007
Tuesday, April 18, 2006
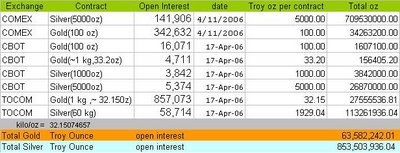
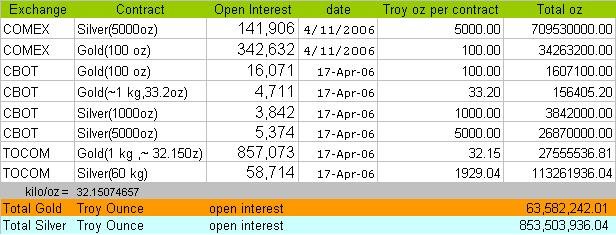
Gold & Silver Open Interest Summery+ XAU & XAG Charts
Here is Gold and Silver open interest Summery table which aggregate the data of the COMEX (NYMEX), CBOT & TOCOM Exchanges.
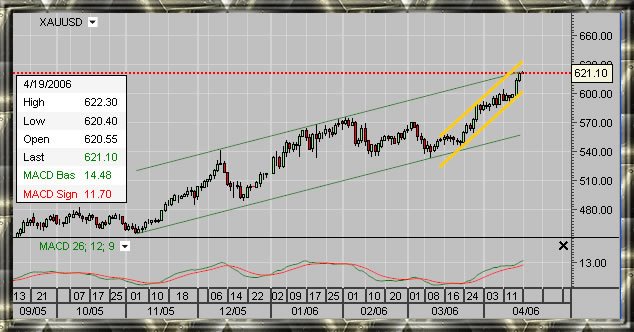
Those are not charts of some hot stocks but charts of natural resources, rare minerals which experienced 20 years bear market , The Third Elliot wave is far from over and can easily exceed the old highs for silver and gold , this markets are relatively small when compared to the other financial markets.
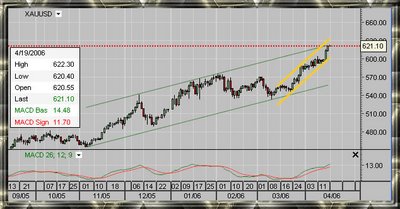
This is not the gold and silver bull market of the 1970's. The Information technology have changed the way markets works, today's market are almost completely computerized. Markets information is much more available to investors all over the world.
The 1980 highs are getting more and more relevant for gold.

See relevant posts:
Long term Gold and Silver charts
Gold measuring (applicable for silver)
Physical vs paper gold
Those are not charts of some hot stocks but charts of natural resources, rare minerals which experienced 20 years bear market , The Third Elliot wave is far from over and can easily exceed the old highs for silver and gold , this markets are relatively small when compared to the other financial markets.
This is not the gold and silver bull market of the 1970's. The Information technology have changed the way markets works, today's market are almost completely computerized. Markets information is much more available to investors all over the world.
The 1980 highs are getting more and more relevant for gold.
See relevant posts:
Long term Gold and Silver charts
Gold measuring (applicable for silver)
Physical vs paper gold
Tuesday, January 24, 2006
Gold Short positions
It is very difficult to know how much gold is really sold short because many trading houses are holding spread positions due to arbitrage trading. Also most of the positions seems to be OTC derivatives.
Here is a summery of the open Interest for the COMEX (NY) , CBOT and TOCOM (Japan), Options are not included.
COMEX (CFTC) : 361,704 x 100 oz = 36,170,400 oz
CBOT : (12,404 x 100 oz = 1,240,400 oz + 4,853 x 33.2 oz = 161119.6 oz) = 1,401,519.6 oz
TOCOM : 342,873 x 33 oz = 11,314,809 oz
COMEX + CBOT + TOCOM = 48,886,728 oz
Links :
BIS OTC DERIVATIVE REPORT REVIEW
DERIVATIVE OTC REPORT OCC
COMEX (CFTC)
CBOT
TOCOM
Friday, January 06, 2006
Wednesday, December 21, 2005
The great Gold paradox (part II)
After reviewing the BIS OTC derivative report It is clear that gold and other commodities ( oil and maybe silver ) are still very important to the global monetary system , It’s very difficult to understand the report for several reasons :
1) The definitions are very general to say the least.
2) The data regarding Commodity contracts ( Gold & other) as well as E. “Other” (defined as : “ Include foreign exchange. Interest rate, equity and commodity derivatives of non reporting institutions, based on the triennial central bank survey on foreign exchange and derivative market activity”) is minimal.
3) Very little transparency.
However my insights are as follows:
1) The OTC derivatives market is huge and growing and might be accelerating! , Grant total notional amounts was 270.1 trillion US$ with Interest rate swaps contracts responsible for the majority (163.749 trillion $). Those numbers are very big compared to any other economic number on earth!
2) The grand total gross market value is much smaller at 10.694 Trillion, tough more volatile and could change quickly!
3) Total commodity contracts value is growing. Standing at 1.693 trillion for notional value and 271 billion for gross value. – note those are huge numbers but are representing just a few percents of the Grand Total for OTC derivatives.
4) Gold contracts, both notional and gross values declined standing at 288 Billion US$ and 24 Billion US$ respectively. Nevertheless those are big numbers representing 693 million gold ounces for notional value and 57 million ounces for gross value. (Calculations based on a 415 $ / OZ at the end of June 05 ). A fairly big number considering total gold world wide production is just 82.5 million ounces annually.
5) Other commodities notional & gross values increased substantially. – We don’t really know what kinds of commodities are included but I guess they include oil and silver.
6) E.other standing at 27.793 trillion and 1.866 trillion for notional and gross values respectively. – the point is (and that’s a big point !) we cant know how many gold & commodities are hiding inside this numbers.
7) The data is super non transparent , but one could feel lucky to have any data at all. The fact is that Gold and other commodities continue to be very important for the global monetary system and one should not rule out a renewed gold standard or something similar , It will be Interesting to see how higher (possibly much higher!) gold price affect the BIS report and the financial health of those holding a short gold position.
Please review the latest BIS OTC derivatives review - (pay special attention for sections D & E of table 1 on page 10.)
yours + real1
Subscribe to:
Posts (Atom)
