Showing posts with label CBOT. Show all posts

Sunday, August 03, 2008

Gold Chart Update (XAUUSD)

Previous week action:

Gold traded between ~893$ and ~934$ which is a 41$ trading range for the week.
Open = 928$ and close 910$, third red candle in a row.

However, gold did not trade below or above any significant low or high.

Cyclical resistance zones: July 15 high of ~988$ and March 17 high (all times high) ~1032.20$.

Cyclical support zones: 12 Jun Low of ~857.45$ May 2 low of ~845.50$.

Pivot zone : ~912$

Currently the most active contract is December gold futures (GCZ8 / ZGZ8 / YGZ8)

Gold spot 8 hours linear chart

Gold spot intraday chart

Sunday, June 29, 2008

Gold Price Analysis


22 – 27 June 2008 August Gold (COMEX GCQ8 , CBOT ZGQ8 & YGQ8)


August gold future contracts ranged 56$ (~877$ - ~933$). Gold begun the week on the weak side (price did not make a lower low vs. previous week) but finished rather strong.

Support zones for GCQ8 : 875$ , 860$, 850$ and lower.

Resistance zones for GCQ8: 940$, 960$ - 964$ and 1041$.

August gold futures (GCQ8) 8 hours chart

comex gold future chart


Note: Gold / Crude oil ratio at historic lows

Tuesday, December 25, 2007

Gold OTC derivatives

Total OTC derivatives are up from ~414 trillion to ~516 trillion for notional amounts outstanding (+24.6%) and up from 9.682 trillion to 11.140 trillion at gross market values (+15%).

Gold OTC derivatives are actually down from 0.640 trillion to 0.426 trillion for notional amounts outstanding (-33.4%) and from 56 billion to 47 billion at gross market values (-16%).

Gold OTC derivatives are still just a tiny part of total OTC derivatives (less then 0.1% for notional value and a~0.42% at gross market values)

The decline of gold OTC derivatives is probably a direct result of:

1) De-Hedging by gold producers.
2) Market participants move their business from OTC derivatives into more liquid, transparent and regulated markets such as COMEX (GC) and CBOT (ZG).

You can see the BIS OTC derivatives report here

Tuesday, July 17, 2007

Gold and Silver Charts

Dear readers,


Yet again, minor consolidation might be over; gold and silver should be ready to move higher. Just my opinion, only the time will tell.


(SIU7) COMEX September Silver Intraday Chart (2 hours sticks)

comex silver chart


(ZGQ7) CBOT August Gold Intraday Chart (2 hours sticks)

cbot gold chart

Thursday, May 24, 2007

ZG, GC & Spot Charts update

Gold options expire, futures contracts are rolled over (June to August), Statistics coming in at 8:30 and 10:00 AM. Technically the market is extremely indecisive and market participants wouldn't want to be heavily committed.

Elliott Wave update will be coming as soon as the picture gets a little bit clearer.

ZGM7 CBOT Gold Intraday (120 minute) chart

CBOT Gold


GCQ7 COMEX Gold daily chart

COMEX Gold


XAUUSD (spot gold) daily chart

XAUUSD

Monday, May 21, 2007

Elliott Wave Principle

Dear readers,

Gold and silver caught some bids today and closed higher along a rising US dollar. Those of you who have been following my posts were certainly not surprised.

Some readers have emailed me with questions like: how do I make my gold price predictions (which are often very accurate) and what technical indicators I use for trading?

Well, I look at many different things: price & volume action, chart patterns, candle sticks, Fibonacci levels, moving averages, PPO, RSI, Stochastic, Inter market relationships, market sentiment and more. But above all cyclical analysis, namely Elliott wave analysis.

Elliott wave analysis is far from being a perfect tool (what is perfect?) However, as regards to making predictions Elliott waves counting when combined with other market indicators is the most valuable tool in my opinion.

Once you understand how the wave principal works, you will learn to respect the market opinion, you will stop looking for reasons to explain why the market is doing this or that. You will learn to accept the cyclical nature of waves.

One excellent book for learning wave analysis is: Elliott wave principle by Frost & Prechter.

By the way, I'm currently reading Prechter's latest book: How to Forecast Gold and Silver Using the Wave Principle. This 483 page book is an amazing documentary which aggregates all of the author gold and silver real time analysis between 1979 -2001.

I will post a more detailed review once I finish reading this book. For now I would just say that while Prechter is usually known for his bearish predictions, I was very surprised to read about some extremely bullish price objective for gold that might still be valid today.


Short term technical update:

The price of gold is still inside the downtrend channel.


ZGM7 – CBOT June Gold Intraday (120 minutes) chart


ZG (cbot gold) chart

Wednesday, May 16, 2007

Gold Channel Chart

The action today give the USD index a green light to go higher, don’t be surprised to see the Dollar index climbing higher for days, weeks and maybe several month.

As far as gold is concerned it is certainly possible that strengthening USD index will have less downside affect on the price of gold, but that remains to be seen.

For Fibonacci levels refer to the previous XAUUSD daily chart.

As always be cautious.


ZGM7 – CBOT June Gold Intraday (120 minutes) channel chart

Friday, May 11, 2007

Intraday Gold Chart

Dear readers,

Most assets rising in price today and the EUR/USD is higher, the price of gold is up. Positive liquidity which is oxygen for all assets markets appear yet again.

Technically: The price of gold managed to break above the sharp short term downtrend line. However, I opine that the last three candles on the daily chart are technically very bearish and that will have more implications going forward. The gold bears have spoken and showed forceful resistance.

ZGM7 – CBOT June Gold Intraday (120 minutes) chart below, annotated with Fibonacci lines and Elliott wave count


CBOT gold chart

Wednesday, May 09, 2007

Gold Market Commentary

As yesterday low failed to hold a selling spree begun. Buyers quickly lowered their bids and the price of gold tumbled. Personally, I had a small short term speculative position which was immediately stopped out for a minor loss. When a FOMC is scheduled I never hold a large position. So it goes...

Technically the daily uptrend is still intact. HUI, XAU, and GOX actually finished the day higher but GDX closed lower. Silver pulled back less then it normally does on events like this.

CBOT June gold (ZGM7) intraday (120 minutes) chart

CBOT gold chart


Gold in nominal USD terms is trading near record levels. If you refer to long term gold charts you will easily notice that gold have been trading at current levels for very short periods of time. I mention this because I think that physical buyers see current levels as unsustainable and thus shy of buying large amounts of gold. Some more time might be needed to digest the current price level. Hence, egg pattern, prolonged incubation process then an inevitable hatch.


All readers are welcome to share their outlook, analysis and opinions. You can do so publicly by posting a comment on blog or privately by email realggp@hotmail.com

Tuesday, May 08, 2007

Gold Charts

Technically there is not much change… The uptrend on the daily chart is intact.

COMEX June gold (GCM7) daily chart- the price is still between the 50 %( 672.50$) and the 61.8 %( 695.8$) Fibonacci levels.


COMEX gold


CBOT June gold (ZGM7) intraday (120 minutes) chart – the price recently bottomed at 670.1$ and again at 684.1$ today. Bottom to top and top to bottom short term Fibonacci levels are added.

CBOT gold

Monday, April 09, 2007

Quick Update

Gold opened with a gap down filled it, made a new high then closed near the day low. The futures volume was low and most of the volume was coming on the down side. From my experience days like this are short term tops candidates (more often then not). Silver was doing better but bumped into short term resistance at spot 13.85$, USD Index trying to rally, Crude Oil down, XAU & HUI unchanged.


CBOT GOLD ZGM7, (enlarge for better view)


CBOT GOLD ZGM7

Wednesday, February 21, 2007

Tricky Gold Market Part II

Dear readers,

Today gold had a big up day after yesterday big down day. Interesting to note that the April Future contract (ZGJ7) high of the day was 703.2$!! . At the same time April Contract at the COMEX (GCJ7) traded not higher then 686.5$. Apparently all buy stop orders at the CBOT where triggered creating a spike up and arbitrage opportunity. This is something that already happened before … Tricks(y) Gold Market

It is amazing that with all the trading algorithms out there no one have come with algorithm to deal with CBOT – COMEX arbitrage. Volunteers?

CBOT Gold Book


CBOT Gold April Chart

Monday, November 13, 2006

Tricks(y) Gold Market

Today at 11:38 (GMT) CBOT Gold Futures Contracts took a deep of about 20$ then fully recovered in less then one minute. About 1100 contracts traded (110,000 Troy ounces) for the ZG contract, According to the CBOT website the mini gold contract (YG) traded as low as 608.8$ while the full size contract (ZG) low was 604.0$.
At the same time NYMEX – COMEX gold contract (GC) was quoted not lower then 621$, The Inter bank and over the counter markets where divided, some followed Cbot while other followed the Comex. All contracts mentioned are December 2006 and spot prices for OTC and Inter bank markets.

Here is what Bloomberg have to report about the issue:


Gold also fell after the sale of the metal in Chicago at a price below the market caused speculators to reduce their holdings.

Gold dropped as much as $26, or 4.1 percent, in electronic trading on the Chicago Board of Trade, to $604 an ounce. The metal in London was trading at the same time at around $625. An estimated 100,000 ounces were sold in Chicago, triggering preset sell orders, said Martyn Whitehead, director of commodity sales at Barclays Capital in London.

``It became a cascade of stop-loss orders, which caused the fairly large $20 gap we saw in the market this morning,'' said Whitehead, who is also vice chairman of the London Bullion Market Association, which runs the gold market in London. ``Someone, somewhere lost a bit of money this morning.''

Prices rebounded before the Comex opening.

``The whole break took about 20 seconds,'' McGhee of Integrated Brokerage said.

Prices May Rebound

Gold may rebound, Perez-Santalla said. ``The gold market didn't drop,'' he said. ``CBOT dropped. Anybody who had stop losses got hurt. It'll remind people of the sensitivities of electronic trading.''

CBOT has captured about 49 percent of the gold-futures market after two years of electronic trading. The exchange last week began open-auction trading on gold and silver contracts to trade side-by- side with its electronic trading platform.

``You have much more of a feel for the market when you're using the floor instead of the screen,'' said Nick Ruggiero, a trader at Eagle Futures Inc. in New York.

Craig Grabiner, a spokesman for CBOT, said he couldn't comment immediately.

-source


Technically it will be logical to assume that gold is retracing some of its 77$ recent move up .

NYMEX-COMEX-intraday gold (GC) chart

CBOT GOLD BOOK

 CBOT GOLD chart

spot gold chart

Friday, October 20, 2006

Gold channel chart

Below is December gold contract (ZGZ6), click to enlarge chart.


December gold  chart

Wednesday, October 04, 2006

Gold ($, €, ¥) weekly charts

Some of the latest gold market news from around the world:

Singapore gold fund trading starts next week

SINGAPORE, Oct 5 (Reuters) - StreetTRACKS Gold Shares (GLD.N: Quote, Profile, Research), the world's largest gold exchange-traded fund, would be cross-listed in Singapore next week in a move to capitalise on Asia's growing fondness for bullion.

It will be listed on Oct. 11 on the Singapore Exchange and would be Asia's first gold-based ETF.

StreetTRACK is the World Gold Council's New York Stock Exchange-listed product, with an average daily volume of around $400 million and assets in excess of $7 billion.-source


Official Statistics Confound Rumour of Heavy Central Bank Sales: CBGA Sales in Year 2 Confirmed as Well Under Quota at 393 Tonnes


As forecast in mid-September’s Gold Survey Update 1, sales by the signatories to the Central Bank Gold Agreement (CBGA) ended up far short of their annual 500 tonne quota at just 393 tonnes. This confounds market speculation during much of September that there had been a last minute rush to sell gold before the end of the second Agreement year (on 26th September) and that this was responsible for the period’s price weakness. -source


Riksbank reallocates gold and foreign currency reserves


The Riksbank intends to sell up to 10 tonnes of the gold reserve during the period 27 September 2006 to 26 September 2007. The sale is in compliance with the Central Bank Gold Agreement (CBGA) which was signed by 15 European central banks and came into force on 27 September 2004. The agreement, which runs for five years, enables the Riksbank to sell up to 60 tonnes of gold during this period. To date the Riksbank has sold a total of 25 tonnes of gold, 15 tonnes during the first year of the agreement and 10 tonnes during the second year. The Riksbank’s gold reserve currently amounts to 160 tonnes of gold.-source


CBOT 100 oz Gold Futures Surpass 60% Market Share


CBOT Full-sized Gold Futures Contract Surpass 60 percent Market Share for the First Time in a Single Trading Day
CBOT Full-sized Silver Futures achieves 10,000 contracts in open interest

CHICAGO October 4, 2006 The Chicago Board of Trade (CBOT) announced today that its Full-sized (100 oz.) Gold futures contract surpassed a market share milestone of

60 percent on October 2, capturing 64 percent of all listed Gold futures traded in North America that day. Open interest in the CBOT Full-sized (5,000 oz.) Silver futures grew beyond 10,000 contracts and set a new record of 10,064 contracts yesterday. The previous record was 9,959 contracts set on September 29, 2006.

Average daily volume in the CBOT Gold complex, consisting of Full-sized (100 oz.) Gold futures and options and mini-sized (33 oz.) Gold futures contracts, reached

52,464 contracts during September and achieved a market share of 54 percent of all Gold futures traded in North America for the month. -source


iShares Silver


BARCLAYS Global Investors has applied to register 15.2 million new shares in its iShares Silver Trust on AMEX doubling the total amount that could be invested, Reuters reported.

"We are registering additional shares. That does not mean the trust is automatically going to buy additional metal," Barclays spokeswoman Christine Hudacko told Reuters.-source


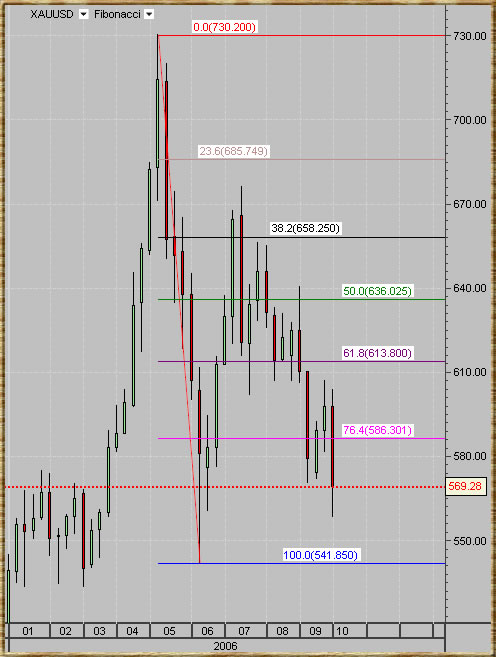
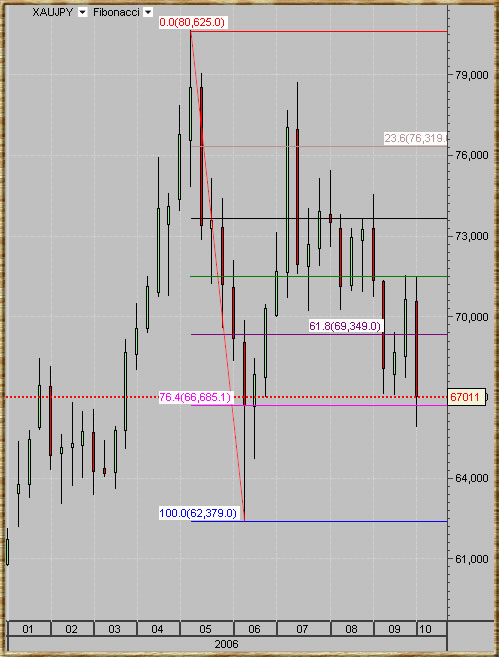
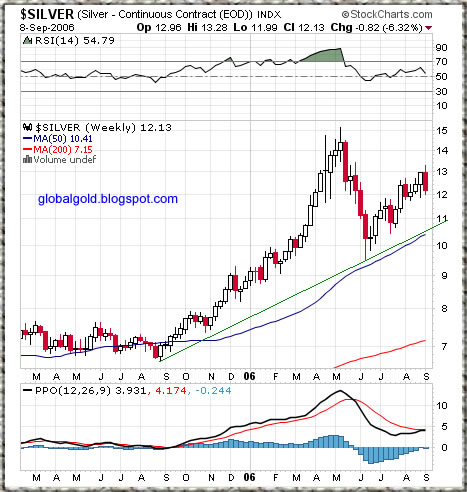
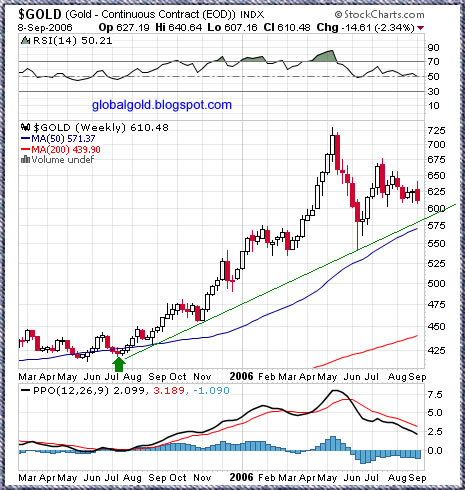
Year to date weekly charts of gold in terms of USD, Euro & Yen.


gold euro chart

gold usd chart

gold yen chart

Saturday, September 23, 2006

Gold Market News

Central Bank to increase gold metal reserves

RBC, 21.09.2006, Moscow 18:45:08.The Bank of Russia intends to increase the volume of gold metals in Russia's gold and foreign currency reserves, the Bank's First Deputy Chairman Alexei Ulyukayev told the State Duma budget committee today. The share of gold in the country's gold and foreign currency reserves is 3 percent at present. If the volume of gold metals increases, still its share will not raise, he noted.

The prices of gold and other precious metals have been rising lately but the market is correcting at present, Ulyukayev stressed. The gold price is now $550 per ounce, which is $80-90 lower than the record price. The metal prices are highly volatile at the moment, but the Central Bank has not imposed any limits on gold acquisition, he said.

Russia's gold reserves exceed 380 tonnes. -source

Agreement on electronic metals trading

By Kevin Morrison

Nymex Holdings is expected to issue $300m of shares to members of its metals futures division Comex, after an agreement on Thursday for Comex gold, silver and copper futures to trade electronically. -source

Finans Portfoy Launches First GOLD ETF in Turkey

Istanbul GOLD ETF, GOLDIST, will be offered to public on September 21st and 22nd.
Finans Portfoy, an Istanbul based asset management company, launches the first GOLD ETF in Turkey. Istanbul GOLD ETF, GOLDIST, will be listed on the Istanbul Stock Exchange and is expected to start trading next week. GOLDIST will be based on international Gold price and denominated in grams. -source


CBOT Expands Availability of Gold & Silver Options to Open Auction Market


CHICAGO, IL (September 20, 2006) – The Chicago Board of Trade (CBOT) announced today that it plans to expand the availability of its options on Full-sized Gold (100 oz.) and Silver (5,000 oz.) futures by listing the contracts on its open auction trading floor, side-by-side with the e-cbot® electronic trading platform, beginning in the fourth quarter of 2006. Currently, the contracts trade exclusively on e-cbot, the Exchange’s electronic trading platform.

Also, effective October 1, 2006, the CBOT is waiving all Exchange transaction fees for Metals options trading for all fee categories. The fee waiver will apply to Metals options trade transactions on both CBOT platforms. The transaction fee waiver will remain in effect until June 30, 2007. -source


American Stock Exchange Lists Central Gold-Trust

NEW YORK, Sept. 22 /PRNewswire/ -- The American Stock Exchange(R) (Amex(R)) announced today that it has begun trading the units of Central Gold-Trust under the ticker symbol "GTU". The Trust began trading on the Toronto Stock Exchange in 2003 under the ticker symbols "GTU.UN" (denominated in Canadian dollars) and "GTU.U" (denominated in US dollars) and is now dually listed on the Amex. -source

Sunday, September 10, 2006

Gold and silver weekly charts

Dear readers, few short notes:

1) Seasonality, depressed sentiment and Euro relative weakness have all brought to an extremely short term oversold condition.

2) The silver chart looks better then the gold chart.

3) In my opinion global geopolitics along global economy developments certainly support higher gold price but not necessarily lower USD index.

4) Long term wave (III) trend lines are annotated on weekly charts, Intraday Cbot active contract is near Fibonacci support level.

 silver weekly chart

gold weekly chart

gold intraday chart

Tuesday, August 29, 2006

Gold (ZGZ6) short term intraday chart

Possible construction of slightly higher gold low. ZGZ6 Contract (CBOT December gold futures) - Fibonacci, intraday chart below (enlarge chart for better view).

Reform on the cards for the IMF

Belgium or India? Which has more clout when it comes to decision making on loans to developing countries and on global economic stability?

Despite India's economy being about twice the size of Belgium's and it having a population of over one billion compared to Belgium's ten million, the European country wields more influence at the International Monetary Fund (IMF).

This is why many think the IMF is ripe for reform - including the IMF itself -source

XAU index Fibonacci chart


intraday gold futures chart

Monday, July 10, 2006

Gold Futures Intraday Chart

The August Gold contract (CBOT : ZGQ6) pulled back 17.70$ since last week high, gold hit the lower Bollinger band (50 MA; STD = 2). Notice that the bands are tightening again and the stochastic indicator is turning bullish. Good chance that a short term bottom is in place and the price of gold is headed back up to challenge its 50 DMA. The action is practically similar for spot gold. Click on the chart to enlarge:

Gold futures CBOT August contract (ZGQ6) Intraday chart

Wednesday, May 24, 2006

Gold and Silver News

CBOT Expands Silver Complex and Launches Full-Sized Silver Futures Options
The Chicago Board of Trade (CBOT) announced today it will expand its Silver Complex by launching a new options contract on its CBOT Full-sized (5,000 oz.) Silver futures contract. The new contract will trade exclusively on the Exchanges premier electronic platform from 6:16 p.m. to 4:00 p.m. (CST) and is scheduled to begin trading on Monday, June 12, under the ticker symbol of OZI. -source

World Silver Survey 2006 Summery
The World Silver Survey contains a global analysis of the world's silver markets and has been produced by GFMS on behalf of The Silver Institute in Washington since 1994 -link

Anglo to dump all of AngloGold
Posted Wed, 24 May 2006
Anglo American will have completely disinvested in AngloGold Ashanti in up to three years, the group said on Tuesday.

According to Anglo American spokesperson Anne Dunn, nothing had been finalised as yet as to how it would go about disinvesting in the world's number three gold miner.

In October last year, Anglo said that because gold assets were valued differently from its other mining assets, and therefore attracted a different set of investors, it would sell its stake in AngloGold.

Since then Anglo dumped some 20 million shares in AngloGold, but still holds a 41.8 percent stake in the gold miner.

Anglo American shares gained 7.94 percent on the JSE on Tuesday, while AngloGold picked up 3.47 percent. -source

I will post gold and silver charts later...