Showing posts with label USD. Show all posts

Monday, May 12, 2008

Gold short term technical update

From mid March to early may the price of the Comex June gold contract (GCM8) pulled back about 190$ (1038$ > 846$) currently trading around 885$ . Along gold recent weakness there is some USD strength vs some of the other popular currencies such as the Euro , Yen , British pound, Swiss frank and others.

The trend is still down ( as defined by the diagonal line connecting the major top (1038$ at mid March) with the secondary top (~956$ at mid April), But there is a minor uptrend inside that bigger down trend channel which give some chance for the 846$ bottom to hold.

Support levels : diagonal minor trend line , ~876$, ~856$, ~846$, ~817$, ~792$

Resistance levels : diagonal downtrend line, ~897$, ~913$, ~930.5$, ~957.5$, ~977$, ~1039$.

June Comex gold futures (GCM8) 8 hours chart

gold comex chart

Tuesday, July 24, 2007

GCQ7 Update

Dear readers,

This will probably be the last GCQ7 chart as gold futures contracts are rolled into December and October (GCV7, GCZ7).

Hype is all over the place so sentiment indicator probably supports the case for some correction here, As previously mentioned USD is trying to bounce.


August Gold - GCQ7 Intraday (120 min) Chart

August Gold

Sunday, July 22, 2007

Gold, USD & Forex Update

Dear readers,

The USD is looking oversold here and some bounce might be expected. If you add a channel the way I did, you can see that the USD index is at the bottom of the channel. In addition, the USD just tested the psychological important 80 level – this level was rarely violated, ever.


USD Index Daily Chart (note the deep oversold condition of RSI 14)

usdx chart


Try to avoid shorting the Yen as the crowed count this currency as a weak one. The interest rate on the yen is low and might continue to stay low for some time but the Japanese economy is not a weak economy in my book, not at all.

Particular vulnerable is the EURJPY pair which had already completed or might be very near to complete a seven years rally. A large correction is expected here – take note!

EURJPY Weekly Chart , Elliott wave count. (click to enlarge)

EURJPY jpy


Gold and silver had a nice rally (as expected) but some significant resistance seen for both. on the other hand gold in terms of Yen and Euro made some advance so the move was not all USD related. If the USD will start strengthening as it might gold can correct some of its recent 47$ rally. Corrections should be seen as a buying opportunity and the June low should hold.

Spot Gold weekly chart annotated with Fibonacci levels. (click to enlarge)


gold chart

Tuesday, July 10, 2007

XAU, XAG & Forex Commentary

Not much change in the USD price of gold (xauusd) today. Gold futures traded and closed slightly higher but priced in Euro and Yen gold is actually down today.

The Euro made a new all time high vs. the USD, EURUSD ~= 1.3740. Note that pre issued Euro high was EURUSD 1.4750, Long term (30 years) retro perspective EUR/USD chart.

Marginal carry traders capitulated as the Yen rallied strongly. Be careful with that one! , Seems like the carry trade become way over crowded as every one and his dog doing the thing.

Silver
up, the high of the day was 13.085 for SIU7 (COMEX September contract)

Silver SIU7 Intraday Chart (2 hours sticks)


Silver COMEX chart

Monday, July 02, 2007

USD Index

This chart does not look good to say the least... , the bounce was disappointing and the new downtrend looks convincing.

Friday, June 22, 2007

And they tell you it is not a currency….

Today gold was clearly trading like a currency and no wonder that silver lagged. (The monetary component within silver certainly exist but for lesser extant compared to gold) Before the New York open gold was higher both in terms of Euro and USD then moved higher in USD and Lower in Euro, later the opposite: up in Euro down in USD, a sell off in both majors then a strong impulsive rally into the close.(Compare minutes XAUUSD with XAUEUR charts to notice that)


Added:

XAUUSD and XAUEUR 2 minutes chart


XAUUSD and XAUEUR


The day to day action is trend less, the downside momentum is gone but some trend line resistance exists.

Gold continue to present a relatively rare opportunity in the global financial market place. An Item which is liquid, time lasting and provides insurance against systematical issues. In addition the possibility for significant price appreciation certainly exists. This is my opinion.


XAUUSD weekly log chart with Fibonacci price projections


XAUUSD chart

Wednesday, May 16, 2007

Gold Channel Chart

The action today give the USD index a green light to go higher, don’t be surprised to see the Dollar index climbing higher for days, weeks and maybe several month.

As far as gold is concerned it is certainly possible that strengthening USD index will have less downside affect on the price of gold, but that remains to be seen.

For Fibonacci levels refer to the previous XAUUSD daily chart.

As always be cautious.


ZGM7 – CBOT June Gold Intraday (120 minutes) channel chart

Monday, May 07, 2007

Gold & the US Dollar

The last time the US Dollar index was around current levels gold was trading almost 250$ lower. In early 2005 a bottom in the USDX was realized and the Dollar climbed 11 points. At the same time gold was initially trading within a tight trading range till breaking out and rallying along the USD.

I have been watching some gold & USDX charts lately, my insights are:

The inverted correlation between gold and the USD is not reliable.

The scenario in which gold and the dollar are both trending higher might repeat again.


USD vs gold chart


Short term bottom seems to be in place (or near) for the USDX. If the Dollar will start to rally soon it might have an immediate negative affect on gold but that will be limited both in terms of price and time.

USD index

Tuesday, April 24, 2007

Update

Quite but tensioned trading as the US Dollar index is very near to historical lows (see USDX pattern target) and the EUR / USD pair is 100 pips below the all time high ( I'm referring the high of the actual Euro , theoretically – pre issued EURO was actually higher). Silver continue to lag behind gold, HUI & XAU pulled back slightly.

In depth look at HUI & XAU.


That’s all for now...

Monday, February 19, 2007

Dollar Index (USDX) Elliott Wave Update

As it seems the USD index is at or near a bottom. If my Elliott Wave count is correct then wave 2 is completed and wave three up is expected to begin and carry the USD index higher then the top of wave one(85.45). for longer term USD index charts and Elliott wave count see Saturday, December 02, 2006 US Dollar Index (USDX) Elliott Wave Update

usd index chart

Tuesday, December 05, 2006

Gold in Euro and Yen

Dear readers,

Don’t be surprised to see Higher USD Index along Higher Gold price.


See also : HUI Breakout

Below are daily charts of Gold in Euro and Gold in Yen, can you see the inverted head and shoulders patterns?


gold euro chart


gold yen chart

Saturday, December 02, 2006

US Dollar Index (USDX) Elliott Wave Update

Dear readers,

The US Dollar Index (USDX) is approaching its Head and Shoulders pattern target (~81.5). The Elliot Waves count on the 3 years weekly chart indicates that once {c – C –(B)} bottom is in place a sustained 5 waves upward move ( Wave C) should start and it will probably last at least one year. Looking at the 20 years chart it is easy to see that the USD index can go a bit higher then 100 and still stay well inside the bear market long term trend. On the bearish side - note the potential gigantic 13 years head and shoulders pattern, the neckline is around 80 and the price target = ~40.


If you are unfamiliar with Elliott Waves, I strongly recommend that you read this short yet excellent EW tutorial.


US Dollar Index (USDX) Elliott  Wave

US Dollar Index (USDX) Long term Elliott  Wave

Sunday, July 23, 2006

Gold/$, Gold/€ & Gold/¥ - Charts and Commentary

Dear readers,

The news which directly or indirectly related to gold are usually subjective and often causing exactly the opposite from what is assumed to be logical (sell the news syndrome). Technicals on the other hand are objective, at least when viewed from numeric perspective.

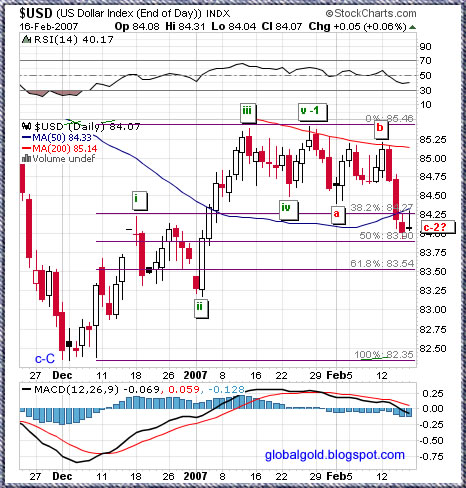
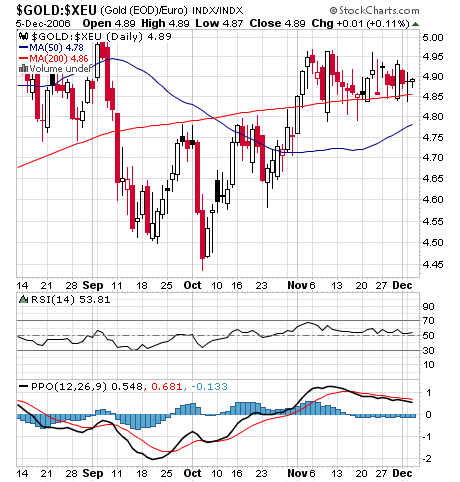
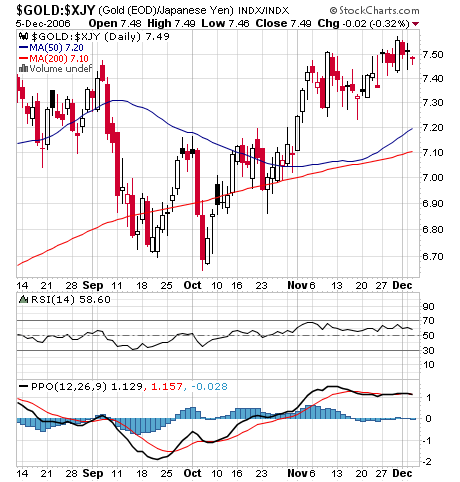
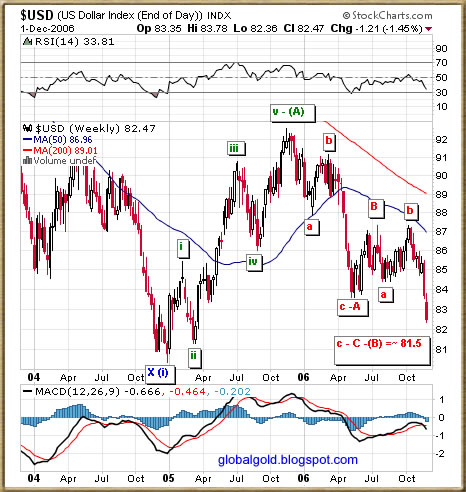
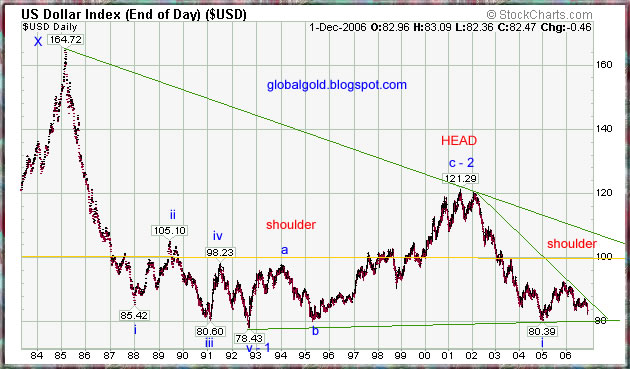
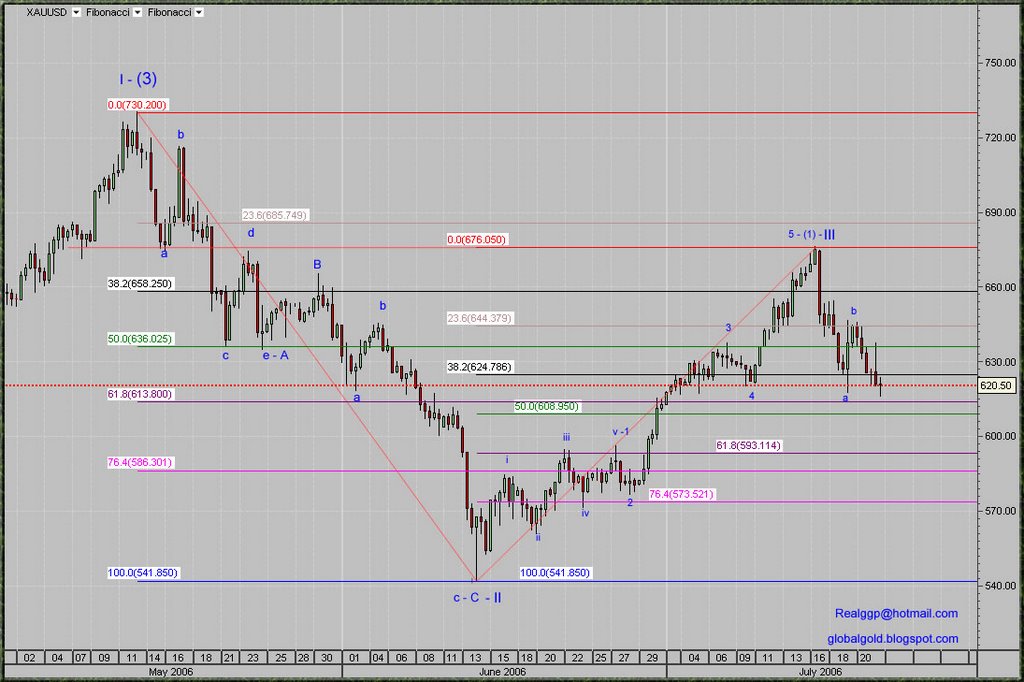
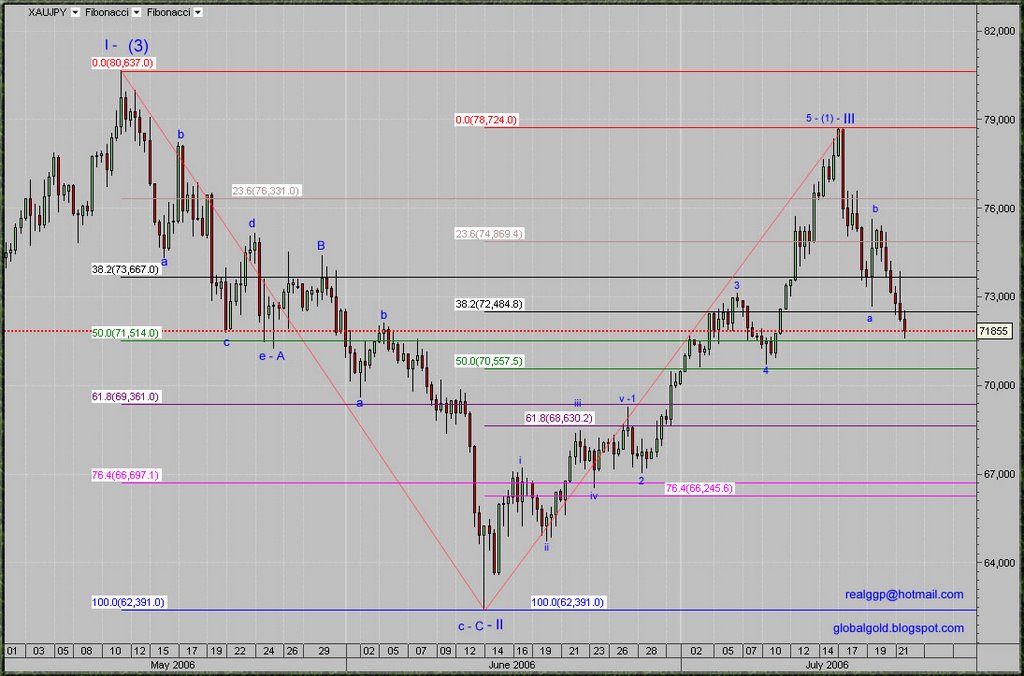
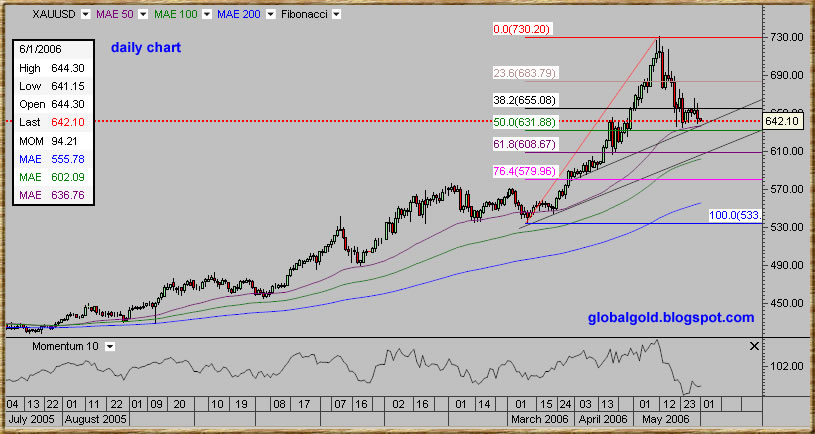
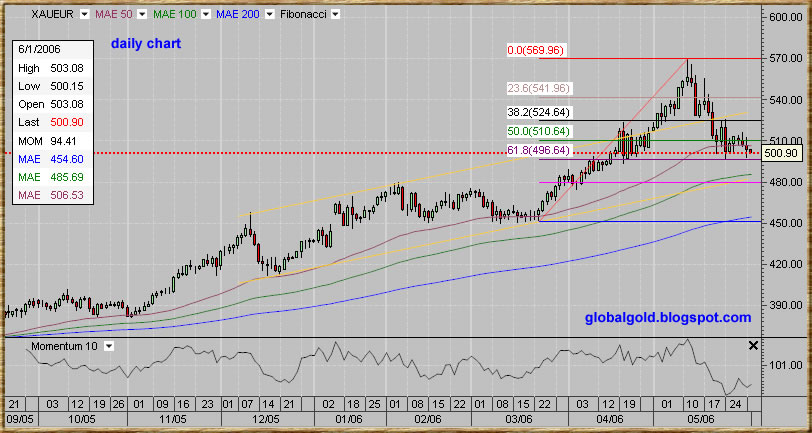
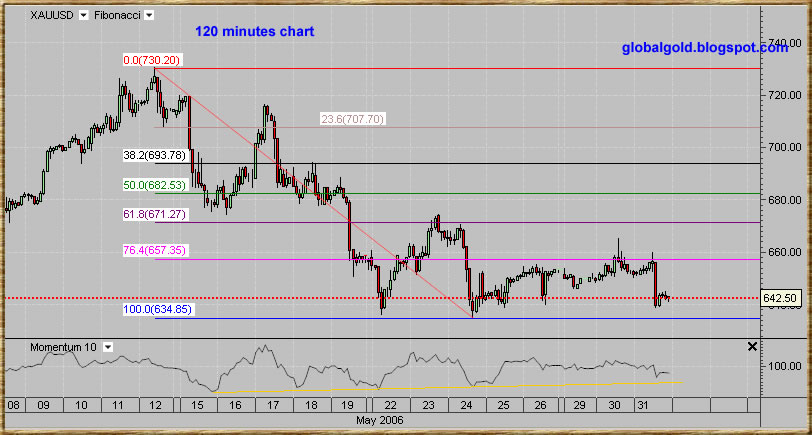
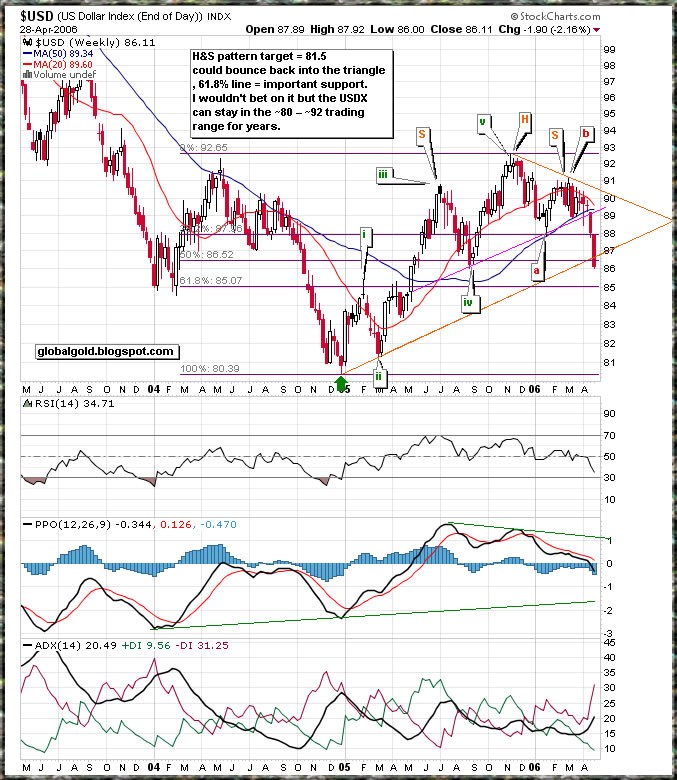
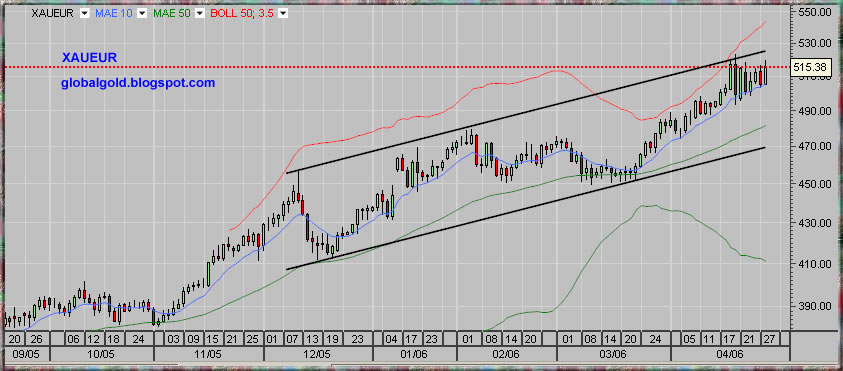
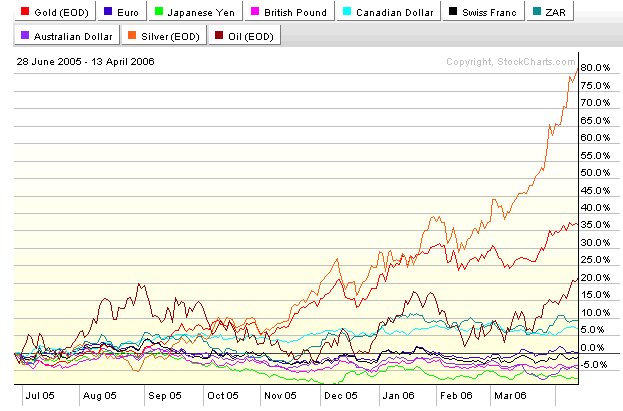
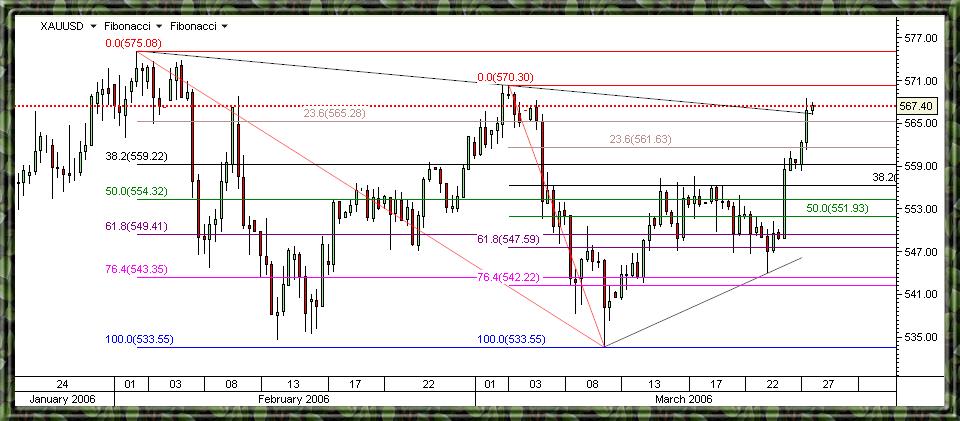
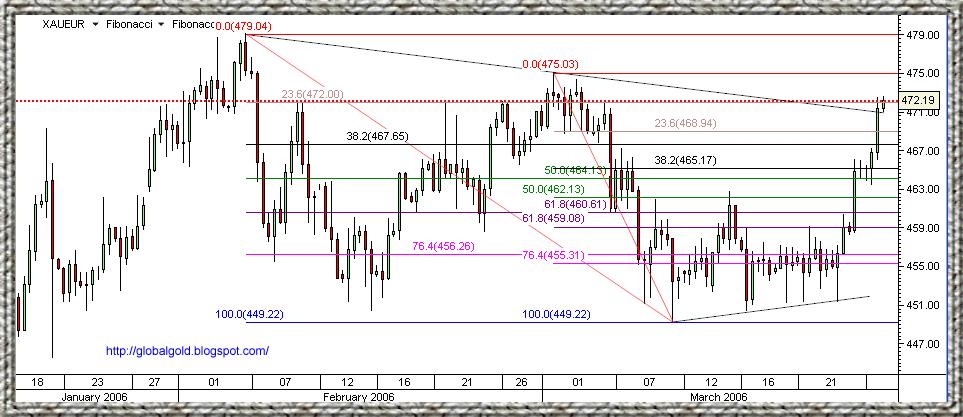
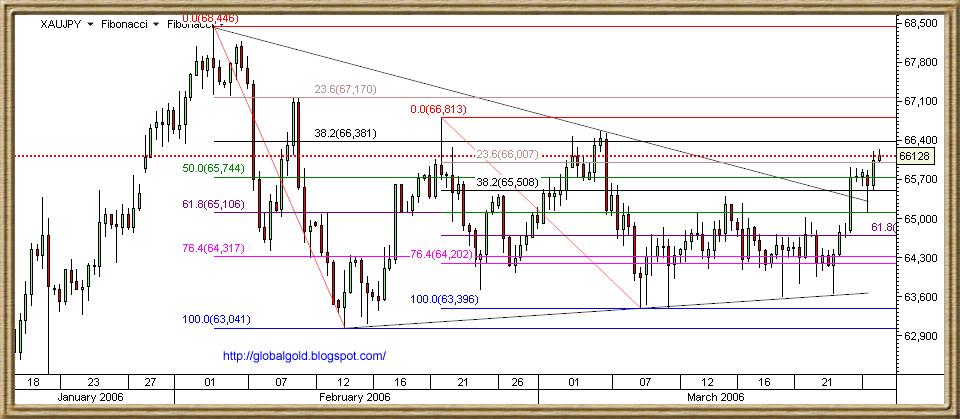
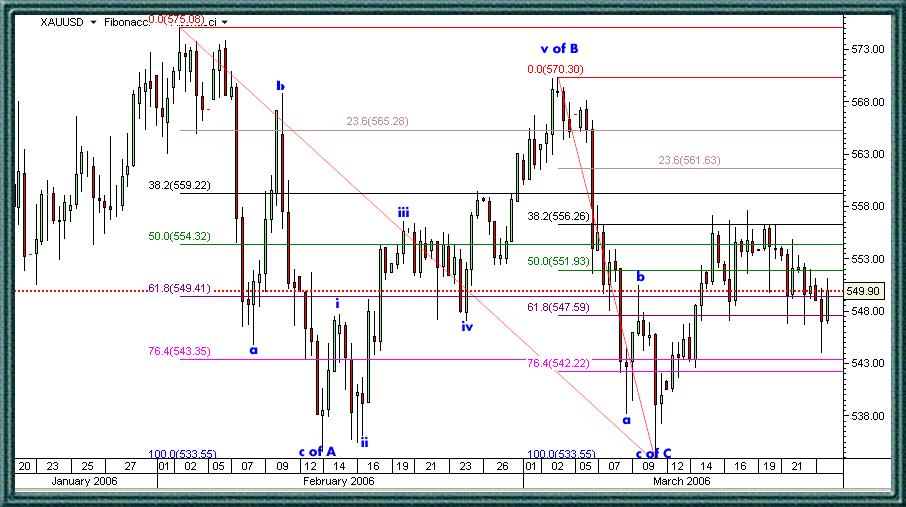
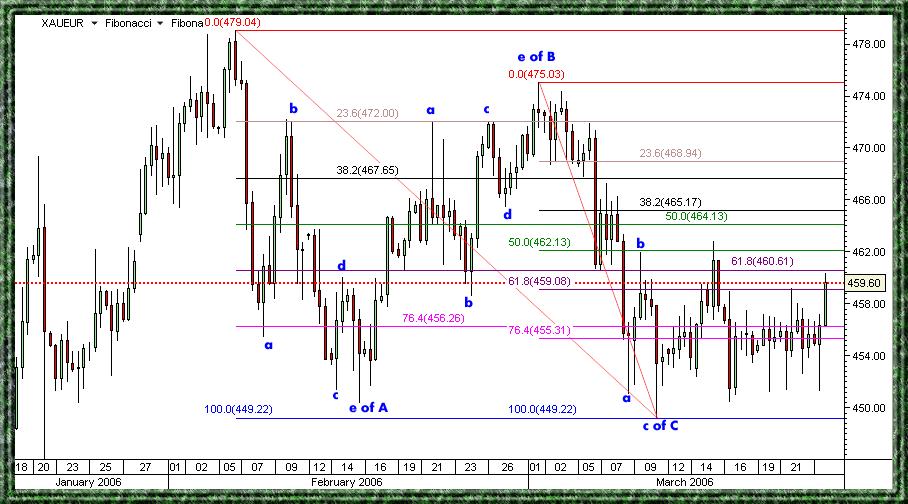
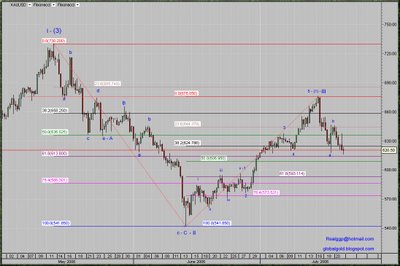
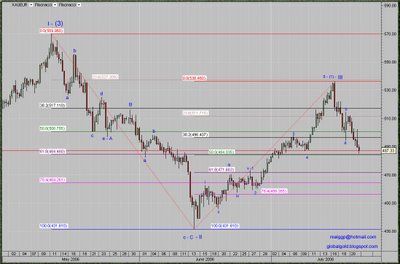
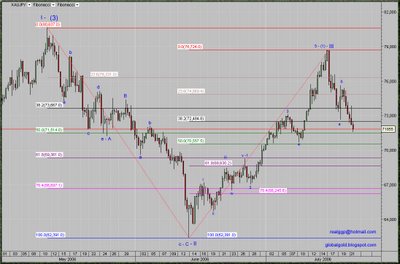
I have prepared three intraday gold charts covering the short term history of Gold/$, Gold/€ & Gold/¥ exchange rates. I added two sets of Fibonacci retracement lines, top to bottom and bottom to top. All three charts are annotated with the same Elliott wave count, high correlation is easily recognized. The pattern similarity between all three charts is indicating that gold is becoming more independent, market factors which used to affect the price of gold (USD index, Euro, Crude Oil. Etc.) are loosing significance. The gold market is evolving to be more mature, the price of gold will be affected by gold market internal forces more then anything else – this is the trend in my opinion. As time goes by and as this great global gold bull market develops, I expect gold influence to grow while gold as a monetary object will be less affected and possibly much less affected by other market variables. Gold and Forex traders should closely observe this development; things that worked in the past might not work in the Future

Gold is completing or already completed its wave (2) – III correction which should be immediately followed by volatile upward movement – wave (3) – III.

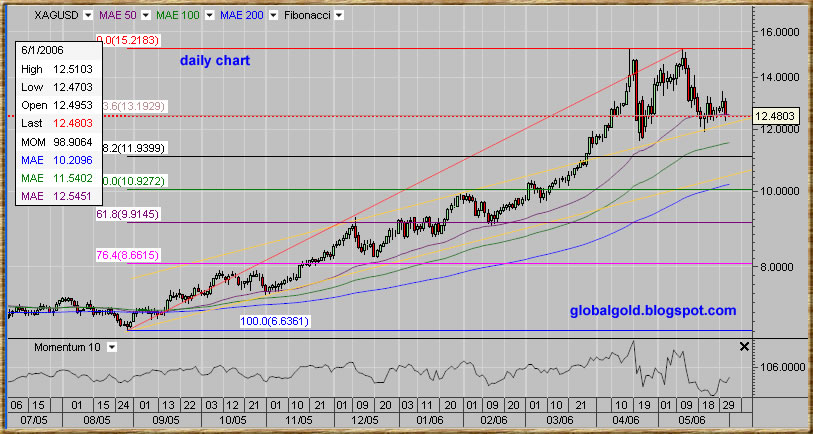
I'm repeating the suggested short term bottom target for Gold/$: 613$, 608$ & 593$.
And adding suggested target for Gold/€: 484€ & 471€ and targets for Gold/¥: 71,514¥, 69,361¥ & 68,630¥.

Click on the charts below for better view.

Spot Gold USD intraday chart

Spot Gold Euro intraday chart

Spot Gold Yen intraday chart

Related:

Gold and Silver Stocks

For basic Elliott Wave Tutorial see EWI (needs free registration)

Sunday, July 16, 2006

EURO / USD Elliott Wave Count Analysis

R.S from Germany asked for my view on the EURO / USD exchange rate.


Please note that theoretically the EURO was as high as 1.45 USD at 1992, since then it didn't manage to make a new high.


Monthly chart shows a triangle pattern with a price objection of 1.45 by early 2009. I see a significant top labeled (v – 1) and then A correction wave to the 38.2% Fibonacci line. B top might be in place and if that’s the case - C low (lower then A) should be expected.

EURUSD monthly chart

Weekly chart – more detailed wave count, currently just around the 50% Fib, the wave count further indicating a completion of a B top.


EURUSD weekly chart


According to my Elliott wave analysis the outlook is short term bearish and long term natural to slightly bullish. A rate exchange of 1:1 (par) will not surprise me.

Related:

Gold Vs. X.

Wednesday, May 31, 2006

Gold , Euro , Yen , Silver & USDX Charts

Gold and silver moved downwards while precious metals stocks moved higher. This is the Great Global Gold & Silver Bull Market and the metals will move higher in each and every national currency. Both gold and silver are accelerating and the volatility can get much higher. When to buy / sell or just hold is highly dependent on who you are and what your style is. I'm just holding and buying the deeps, ~100$ sell off is deep enough for me. The Gold Silver ratio (XAU / XAG) = ~51.44, Dow / Gold = ~17.39, Gold / Crude Oil = ~9.02.


Gold and Silver Mining Stocks

Commodities Charts

Elliott Wave Tutorial

Here are some charts of Gold in Euro, Yen, US Dollar Index & Silver.

Spot Gold USD

XAUJPY, Spot Gold Yen

XAUEUR, Spot Gold Euro

XAGUSD, Spot Silver daily chart

XAGUSD, Spot Gold Intraday

US Dollar Index, USDX

Sunday, April 30, 2006

USDX E - waves & Gold / Euro update

The Gold Silver ratio (XAU / XAG) = ~ 47.70, Dow / Gold = ~17.38, Gold / Crude Oil = ~9.13.

The U.S. Dollar Index (USDX) – has been around since 1973. USDX is computed using a trade-weighted geometric average of six currencies. The six currencies and their trade weights are: Euro -- 57.6% Japan/yen -- 13.6% UK/pound -- 11.9% Canada dollar -- 9.1% Sweden/krona -- 4.2% Switzerland/franc -- 3.6%. USDX chart is showing a pattern of Head & Shoulders and the target = 81.5, could bounce back into the triangle , 61.8% line = ~85 =important support. I wouldn’t bet on it but the USDX can stay in the ~80 - ~92 trading range for years.

Gold in terms of Euro is showing similar pattern like Gold / USD , not surprising – is it?

click on the charts below to enlarge:

USDX USD index chart


GOLD Euro chart

Friday, April 14, 2006

Gold vs. X

There are numerous press release, short recommendation, publication and observation which are all stating a bearish view toward the USD. I am well aware of the arguments which imply that the USD should head lower vs. other national currencies and there is no need to mention them. But, as I already discussed in several previous posts, the Forex market seems to be well managed toward stability.

Here is a performance comparison 200 day chart between several popular national currencies, Gold, Silver and OIL. Looking at the chart it is very easy to notice that almost all national currencies are actually down to unchanged against the USD (200 days time frame) the exceptions are the South African Rand (ZAR) and the Canadian Dollar – both are gold, silver & commodity rich nations.

performance gold chart

The conclusion is this: Under current market conditions it is a possibility that the USD will continue to stay relatively unchanged vs. other national currencies. Regardless of the country you are living in, gold and silver savings have been profitable the last 200 days. Investors who look for currency diversification should look at gold (with a glance of silver) and ignore the minor fluctuation in the Forex market.

Monday, March 27, 2006

Gold / $,Gold / € & Gold / ¥ [update]

Gold continue to show strength and to perform against all the three major currencies. The upper downtrend line is broken for Gold / Yen , Gold / USD & Gold / Euro currently struggling against the upper downtrend lines. There is some overhead resistance around recent highs, likewise good support at appropriate Fibonacci levels. Click on the charts below to enlarge:

Gold / $ intraday chart


Gold / € intraday chart

Gold / ¥ intraday chart

Thursday, March 23, 2006

Gold / USD, Gold / Euro & Gold / Yen Exchange rates charts

Yes! The Silver break out continue, Spot silver currently trading around 10.65 $ per 1 Oz.


Year of the dog silver coin

However, I will like to concentrate on silver bigger brother = Gold.
Gold is looking a bit tired but it seems comfortable at ~550$, ~455€, ~64,000¥.
The price of gold in terms of US Dollar, Euro and Yen is nicely correlated and the wave count is very similar.


Click on the charts below to enlarge Gold / USD, Gold / Euro & Gold / Yen Exchange rates charts annotated with two sets of Fibonacci levels and Elliot waves counts:

Gold USD

Gold Euro

Gold Yen

Friday, December 30, 2005

Gold 2005 Summery

Good year for Gold, Silver, Metals and most of the Commodity sector. Nice gains for the companies who dig for all the stuff we need. The global population is growing and developing countries need more basic materials to produce a higher standard of living.
Don’t forget the commodities are just climbing out of a 20 years devastating bear market hole.

I Don’t have any prediction for the paper Forex market – which is very unpredictable and highly managed. I don’t see a better paper currency then the US dollar. The USA is still the strongest country and the very important reason - the Fed is still the biggest gold holder(?).

Gold and silver - the monetary commodities did not gain as much as other commodities this year, but that could change next year - for the fact they have the monetary ingredient.
Over all I expect gold and silver to really outperform other sectors in 2006, we could easily see a 50% gain in the price of gold and the price of silver the next 12 months.


gold chart