Showing posts with label Commodity. Show all posts

Tuesday, July 24, 2007

GCQ7 Update

Dear readers,

This will probably be the last GCQ7 chart as gold futures contracts are rolled into December and October (GCV7, GCZ7).

Hype is all over the place so sentiment indicator probably supports the case for some correction here, As previously mentioned USD is trying to bounce.


August Gold - GCQ7 Intraday (120 min) Chart

August Gold

Monday, July 02, 2007

Positive Reason

Interesting times head as significant adjustments are in the works. Currencies, Silver Gold, Oil, Stocks all in the equation with the most controlled item actually needs to be Interest rates.

Commodities continue to trade with a group and / or individual bias. Generally it might be the case that commodities are the best play as the long term (decades) cycle is probably most favorable for this asset class.

Gold and Silver fundamentals have never been better with global system adjustments seen as a long term positive. Significant amount of shorting taking place and some of it probably un hedged (naked).

Exact timing and finding reasons for the day to day action is tricky.

Saturday, March 17, 2007

Gold & Silver Charts

Dear readers,

The price action of gold was somewhat mild recently as the money metal consolidated around its 50 days moving average. The uptrend which connects the October 2006 and January 2007 lows is still intact, additional support levels at the 200 daily MA and a bit above the January low. In my opinion there isn't much conviction yet as if another leg up will begin from here or is further decline might be required. Silver is looking to me a little bit stronger but not much strong either. The HUI is indecisive at best and lately I was bubbling something about the approach of long term buy & hold commodities?


gold daily chart


silver daily chart

Friday, February 16, 2007

Gold Market Commentary

Dear readers,

In order to understand the current price behavior of gold you have to go back to the early 1980. Back then gold topped at 850$ an ounce, this is also the all time nominal top as most of you probably know. After going extremely parabolic and rising more then 100% in less then 2 month the price of gold immediately crashed back to 500$ in less then two month. Few month later a secondary top was created with a base at 600$ and several peaks above 655. – This is long term support & resistance.


Gold Fix Price 1980

gold fix price 1980 chart


Back to the present; consider the significant pullback in the price of: Crude Oil, Copper among other base metals and broad commodity indices. Gold stocks indices and also Silver did not confirm the recent highs. All this factors and more…support a pullback sooner rather then later. Refer to previous posts for short term Fibonacci support levels which seems to be abundant between 648$ and 600$. From an Elliott Wave perspective a pullback to not lower then 600$ is normal and my wave count stays unchanged.

Wednesday, June 14, 2006

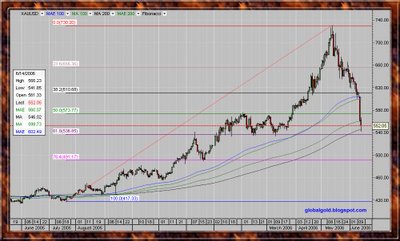
Gold Global Perspective > Licking the wounds…

It's difficult to be bullish on gold in the face of a 180$ one month decline. I feel your pain (or gain) and my only offer is to count your ounces - If you got any left…

The year is not even half done and the price of gold rallied 200$ then gave it almost all back. – Interesting to say the least.

Mr. Gary Dorsch published an Interesting article: Central Bankers declare War on Gold and the “Commodity Super Cycle” - you can read it @ gold seek.

Feel free to browse the archive

Click on the chart below to enlarge

Gold spot daily chart

Monday, May 15, 2006

Gold & Silver Sharp Sell Off !!

Gold, Silver, Metals, Oil and most of the commodities experienced a sharp sell off today. Is this the end of the Gold, Silver, commodities bull market? – I don’t believe so!
I do think that most if not all the commodities will head higher and one should concentrate on finding buying opportunities. This is exactly what I'm doing, adding to my positions from time to time when my free cash flow allow it.


If you need Free Real time quotes and charts for gold, commodities, forex and stocks (registration is required) try ADVFN

Here is an annotated intraday spot gold chart, you can click on the chart to enlarge.

Gold spot intraday chart

Wednesday, May 10, 2006

Gold Global Perspective update

It was another good day for the precious metals complex investors. The Gold Silver ratio (XAU / XAG) = ~48.99, Dow / Gold = ~16.47, Gold / Crude Oil = ~9.79.

Silver continue to consolidate just under the recent high, once the April high is taken the price of silver will face the 1983 high of around ~15$. The recent consolidation pattern will serve as good support in case of any pullback.
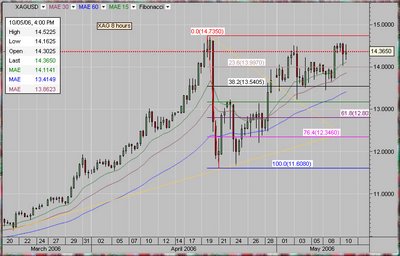

Spot Silver intraday chart


Gold, Silver, Platinum, Palladium, Copper, Aluminum, Crude Oil WTI, Natural Gas, Unleaded Gasoline & CRB Index charts. -link

Gold / Silver, Platinum, Palladium, Copper, Aluminum, Crude Oil WTI, XAU , HUI & CRB Index ratio charts. -link

Gold in terms of: Euro, Yen, Pound, Australian $, Canadian $, Rand, Frank, USDX. -link

Retail gold prices soar to hit 100-year high
CHAROEN KITTIKANYA

Local retail gold prices have hit an all-time high of more than 12,900 baht per one-baht weight (15.16 grammes) of ornamental gold.

Prices are now at their highest point in more than 100 years, driven up by global gold prices, which this week rose to a 25-year high of more than $700 per ounce, according to the Gold Traders' Association.

According to Pichaya Phisuthikul, the association's secretary-general, local gold prices rose yesterday by 300 baht, with the price of ornamental gold standing at 12,900 baht per one-baht weight, from 12,600 baht on Tuesday, and gold bar at 12,500 baht, a rise from 12,200 baht. -source

Wednesday, May 03, 2006

Gold XAU 666 Commentary

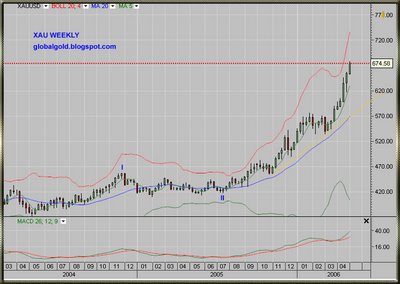
Gold, Silver and other precious metals like palladium and platinum continue to show excellent performance. Gold cleared the 666$ mark with success that few predicted.
Most gold market commentaries continue to try and explain the roaring price of gold with non direct gold market factors like the Iran conflict and the USDX weakness.

It is reasonable to assume that the Iran issue does have some gold market psychology effect and the outcome is higher short term demand for gold. However this factor is psychological by large and difficult to quantify.

The USDX is completely different factor with longer term structural implications. The correlation between a weakening or potential weakening USDX and rising gold price is losing significance at this stage of the great global gold bull market (GGGBM). The price of gold have recently gained nicely when measured with each and almost every national currency (Gold vs. X)

In the same time direct gold market factor - the relatively large gold short positions that some of the gold mining companies ( Barrick gold ABX, AngloGold Ashanti AU) and other market participants are holding are hardly mentioned. I have mentioned these issues in the past couple of months and you can see more information by searching this site archive. If you are interested in more information regarding internal direct gold market factors I recommend reading the Cheuvreux gold report, the BIS OTC derivatives report as well as this very short Open Interest summery (OI). For those with TA orientation I suggest concentrating on the long term gold charts and using Elliott Wave principle which can at least give a good methodology for mapping of the gold price behavior on different time frames. Elliot wave counting can also improve and enhance the gold price prediction ability especially when combined with Fibonacci series and other technical analysis tools.

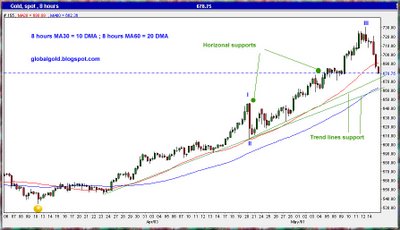
Technically short term continued extraordinary strength of impulsive extensive third up wave, not much resistance to be found. As mentioned the secondary b high of September 1980 is worth watching, Now that 666$ price is cleared next obvious psychological upside level is 777$.


Gold spot XAU chart


Suggested books:

Applications of Fibonacci Numbers : Volume 6

Fibonacci and Gann Applications in Financial Markets : Practical Applications of Natural and Synthetic Ratios in Technical Analysis

Elliott Wave Principle Key to Market Behavior

Liar's Poker: Rising Through the Wreckage of Wall Street -Insightful & Funny

Thursday, April 13, 2006

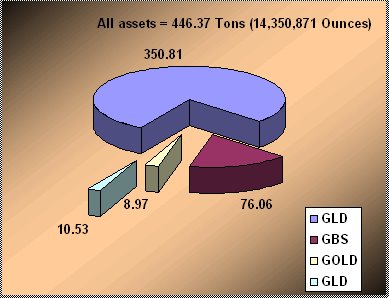
Exchange Traded Gold funds - ETF ( GLD , GBS , GOLD)

There are currently 4 ETF's which claim that their gold assets are backed by allocated gold held in a vault on behalf of investors. Tottal assets ( as of April 12 2006) = 446.37 Tone (14,350,871 Ounces)

( GLD ) New York Stock Exchange (NYSE) Streettracks, Gold Shares. - link

( GBS ) LSE (London Stock Exchange) AND Euronext Paris Gold Bullion Securities. - link

( GOLD ) Australian Stock Exchange (ASX) Gold Bullion Securities. - link

( GLD ) Johannesburg Securities Exchange (JSE) New Gold Debentures - link

Exchange Traded Gold funds - ETF ( GLD , GBS , GOLD)

( AMEX : DBC ) Deutsche Bank Commodity ETF ( DBLCI )
( AMEX : USO ) United States Oil Fund Lp


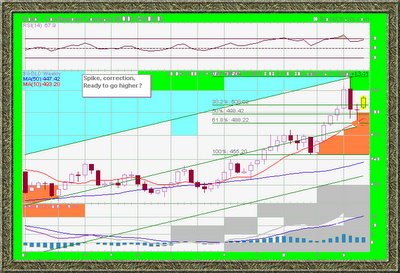
GLD , New York Stock Exchange ETF (NYSE) Streettracks, Gold Shares chart

Friday, December 30, 2005

Gold 2005 Summery

Good year for Gold, Silver, Metals and most of the Commodity sector. Nice gains for the companies who dig for all the stuff we need. The global population is growing and developing countries need more basic materials to produce a higher standard of living.
Don’t forget the commodities are just climbing out of a 20 years devastating bear market hole.

I Don’t have any prediction for the paper Forex market – which is very unpredictable and highly managed. I don’t see a better paper currency then the US dollar. The USA is still the strongest country and the very important reason - the Fed is still the biggest gold holder(?).

Gold and silver - the monetary commodities did not gain as much as other commodities this year, but that could change next year - for the fact they have the monetary ingredient.
Over all I expect gold and silver to really outperform other sectors in 2006, we could easily see a 50% gain in the price of gold and the price of silver the next 12 months.


gold chart