Showing posts with label SLV. Show all posts

Wednesday, October 04, 2006

Gold ($, €, ¥) weekly charts

Some of the latest gold market news from around the world:

Singapore gold fund trading starts next week

SINGAPORE, Oct 5 (Reuters) - StreetTRACKS Gold Shares (GLD.N: Quote, Profile, Research), the world's largest gold exchange-traded fund, would be cross-listed in Singapore next week in a move to capitalise on Asia's growing fondness for bullion.

It will be listed on Oct. 11 on the Singapore Exchange and would be Asia's first gold-based ETF.

StreetTRACK is the World Gold Council's New York Stock Exchange-listed product, with an average daily volume of around $400 million and assets in excess of $7 billion.-source


Official Statistics Confound Rumour of Heavy Central Bank Sales: CBGA Sales in Year 2 Confirmed as Well Under Quota at 393 Tonnes


As forecast in mid-September’s Gold Survey Update 1, sales by the signatories to the Central Bank Gold Agreement (CBGA) ended up far short of their annual 500 tonne quota at just 393 tonnes. This confounds market speculation during much of September that there had been a last minute rush to sell gold before the end of the second Agreement year (on 26th September) and that this was responsible for the period’s price weakness. -source


Riksbank reallocates gold and foreign currency reserves


The Riksbank intends to sell up to 10 tonnes of the gold reserve during the period 27 September 2006 to 26 September 2007. The sale is in compliance with the Central Bank Gold Agreement (CBGA) which was signed by 15 European central banks and came into force on 27 September 2004. The agreement, which runs for five years, enables the Riksbank to sell up to 60 tonnes of gold during this period. To date the Riksbank has sold a total of 25 tonnes of gold, 15 tonnes during the first year of the agreement and 10 tonnes during the second year. The Riksbank’s gold reserve currently amounts to 160 tonnes of gold.-source


CBOT 100 oz Gold Futures Surpass 60% Market Share


CBOT Full-sized Gold Futures Contract Surpass 60 percent Market Share for the First Time in a Single Trading Day
CBOT Full-sized Silver Futures achieves 10,000 contracts in open interest

CHICAGO October 4, 2006 The Chicago Board of Trade (CBOT) announced today that its Full-sized (100 oz.) Gold futures contract surpassed a market share milestone of

60 percent on October 2, capturing 64 percent of all listed Gold futures traded in North America that day. Open interest in the CBOT Full-sized (5,000 oz.) Silver futures grew beyond 10,000 contracts and set a new record of 10,064 contracts yesterday. The previous record was 9,959 contracts set on September 29, 2006.

Average daily volume in the CBOT Gold complex, consisting of Full-sized (100 oz.) Gold futures and options and mini-sized (33 oz.) Gold futures contracts, reached

52,464 contracts during September and achieved a market share of 54 percent of all Gold futures traded in North America for the month. -source


iShares Silver


BARCLAYS Global Investors has applied to register 15.2 million new shares in its iShares Silver Trust on AMEX doubling the total amount that could be invested, Reuters reported.

"We are registering additional shares. That does not mean the trust is automatically going to buy additional metal," Barclays spokeswoman Christine Hudacko told Reuters.-source


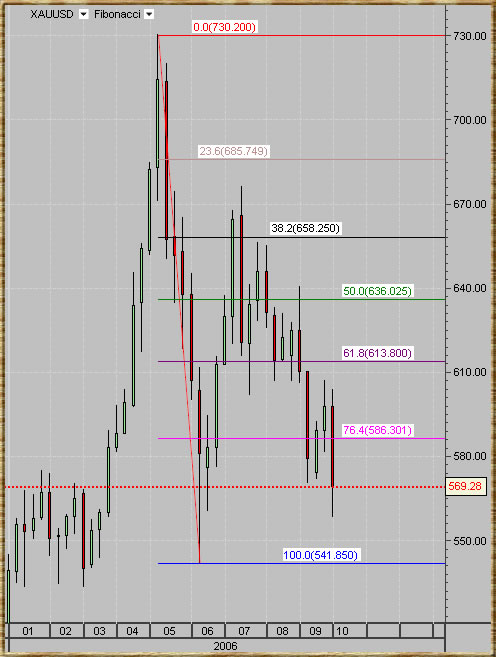
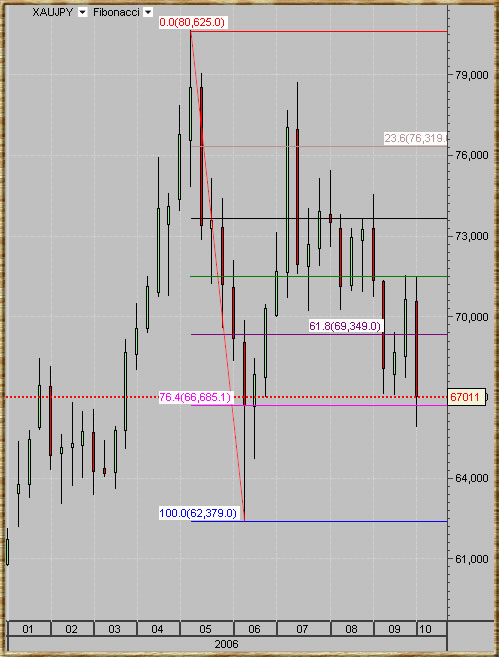
Year to date weekly charts of gold in terms of USD, Euro & Yen.
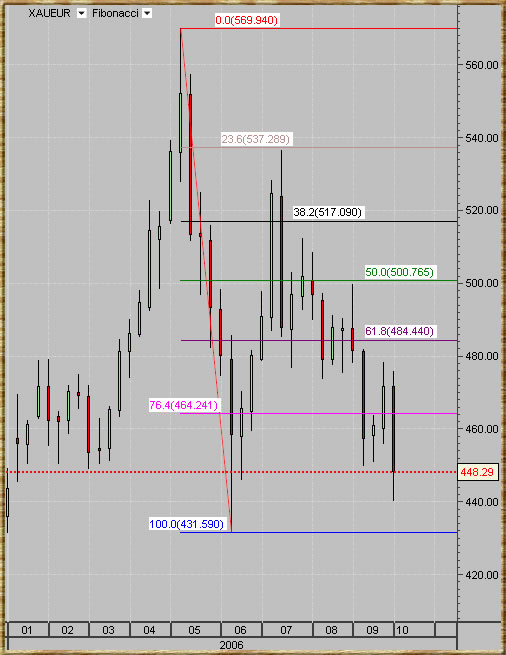

gold euro chart

gold usd chart

gold yen chart

Friday, April 28, 2006

Gold Channel & Silver ETF , SLV

There is probably a lot of highly leverage day trading taking place in the precious metals market. This kind of silver (XAG) and gold (XAU) gambling is taking place in the form of derivatives, CFDs and in house forex speculation. The intraday gold price pattern of yesterday shows a pattern of M or W, this kind of pattern is deadly for over laveraged traders since its clear their stops loss then reverse and run away the other direction. Leveraged gold and silver trading is not recommended to anyone but the most professional, experienced deep pockets traders. Ride the wave safely, don't be greedy – it's that simple.

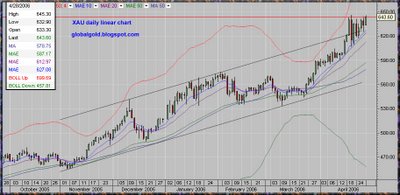
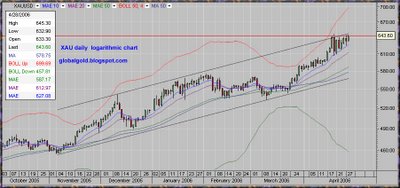
As for the technical picture, here are two daily gold spot (XAU) charts with exactly the same settings (Channel, EMA, MA & Bollinger Bands). The only difference, the first one is a linear chart while the second one is logarithmic. The linear XAU chart shows that gold is trading above the previous upper diagonal channel trend line. The logarithmic gold chart shows that gold is trading just below the same diagonal line. The reason for this is the fact that as the price of gold is accelerating the difference between measuring the price of gold in terms of percentage vs. nominal is more significance. This makes the use of linear trend lines more complex and EMA might be used to give a better exponential / non linear perspective.

Silver ETF , symbol SLV is issued today (AMEX) and since the Silver ETF IPO is widely expected and the price already corrected it should be a non event.


First U.S. Silver ETF Launches Friday A.M.By: Dorothy Kosich
Posted: '27-APR-06 23:00' GMT © Mineweb 1997-2004

RENO--(Mineweb.com) As the first U.S. Silver ETF is officially launched by Barclays Global Investors Friday morning, Silver Institute President Phil Baker, the Chairman and CEO of Hecla Mining, told Mineweb that he views it as a positive move that will, ultimately, generate more interest in silver equities.

Michael DiRenzo, Executive Director of the Silver Institute, noted that the "this investment vehicle will give a wide range of investors the opportunity to diversify their portfolio to silver."

Christine Hudako of Barclays confirmed to Mineweb Thursday that the silver ETF will launch Friday morning on AMEX under the name iShares Silver Trust, (SLV). Earlier this week, Barclays deposited 1.5 million ounces of silver with the JP Morgan Chase Bank to back its 150,000 ETF shares. Each share is equivalent to 10 ounces of silver. source


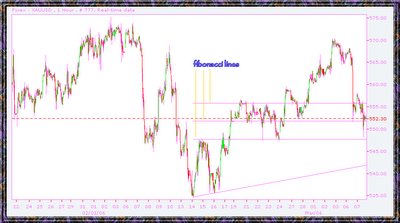
Gold spot chart

Gold spot log chart XAU

Platinum long term charts , HUI – Amex Gold Bug Index E – Waves

Tuesday, March 07, 2006

Gold and Silver, Virtual vs. Real

Genesis 13:2 (New International Version)
New International Version (NIV)

"Abram had become very wealthy in livestock and in silver and gold."

The last couple of trading days gold and silver lost some synchronization, while both sharply declined yesterday silver quickly based around support but gold drifted lower.
In my opinion a good reason for this could be the real vs. virtual metals issue. As I wrote already a couple of times - I think that Investors preferences are changing at this stage of the Great Global Gold (& Silver) Bull Market (GGGBM or GGSBM). Not all gold holdings are equal, for example a 1 oz gold coin in your hand does not equal 10 GLD shares in your broker account. I have been long saying that Investors (especially small investors) should own physical metals (preferably at home).

Don’t get me wrong , If for some reason your only way to invest in gold is a gold fund then it better then nothing, but If you can choose between 10 gold coins and 10,000$ in a gold fund I will definitely choose the gold coins.
There is much to say about real vs. virtual metals and obviously I cannot cover this entire subject in one day. One more point – It's not black or white it is more like a real vs. virtual scale. So what I see in the market is this: Investors are loosing some appetite for Precious metals stocks and for now they find confidence in buying silver coins. I will soon write more about this issue but for now Silver is set to lead but the out look for gold continue to be positive.

For HUI(AMEX Gold Bug Index) chart click Here

Click on the charts below to enlarge:

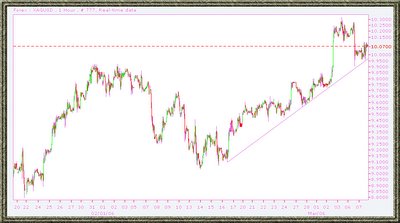
gold spot
silver spot

Monday, March 06, 2006

LSE to launch silver tracker fund

Virtual silver fund, bulls get a bit disappointed...

By Kevin Morrison
Published: March 6 2006 17:44 | Last updated: March 6 2006 17:44

A silver price tracker fund, also known as an exchange traded fund, is expected to be launched on the London Stock Exchange within the next month by ETF Securities, which has already launched an oil-backed ETF on the LSE.


The planned new investment product is separate to the silver-backed ETF filed by Barclays Global Investors with the Securities and Exchange Commission, which is expected to make a decision shortly on the proposal.

It is understood that ETF Securities has approval from the UK’s Financial Services Authority. ETF Securities is controlled by Graham Tuckwell, who listed the world’s first commodity-backed ETF when he launched Gold Bullion on the Australian Stock Exchange three years ago.

Silver prices closed at a 22-year high last week, and were trading at $10.25 a troy ounce in mid-afternoon trade in London, up 7 cents from Friday’s close.

Expectations of a launch of a new silver-ETF in the US have been a key driver behind the recent surge in the silver price, which has risen 60 per cent since the start of 2005. Once fully issued, the proposed BGI silver ETF would require the purchase of 130m ounces of silver, according to the fund’s prospectus.

However, few have factored in the possible listing of a silver investment product in London.

Unlike the various gold and oil backed ETFs and the BGI initiative, the proposed silver fund in London will not be physically backed by the underlying commodity.

The funds raised by the proposed London listed silver ETF would not be spent on buying the metal, but the performance of the fund would remain linked to the silver price. Funds raised by existing commodity-backed ETFs are spent on buying the physical commodity, which adds to the increase in demand.

Advisers to ETF Securities have warned that demand for a silver ETF could distort prices and affect demand as the silver market was too small to support large amounts of the metal allocated to investors. This is an argument used by the Silver Users Association in its opposition to the proposed US silver ETF.

“We do not have to look back very far to see the impact a significant amount of allocated silver would have on the market. It was 1998 when Warren Buffet purchased over 100m ounces of physical silver and the spot price rallied over $3,” it said.
source


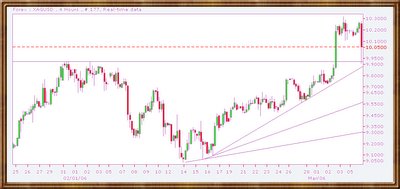
 spot silver chart

Friday, February 17, 2006

Silver ETF

This is what the Silver Users Association say about the subject :

Silver Market
Between 1966 and 1970, U.S. Treasury sales of silver were a major secondary source of supply. Because silver had been a U.S. monetary standard along with gold, the U.S. government held the world's largest source of secondary supply in an effort to meet a growing production/consumption deficit. In 1965, it appeared that in less than two years the Treasury would effectively lose control of the price of silver. If silver had been allowed to rise above $1.40 per ounce, the silver content of U.S. coins would have been worth more than their face value, causing them to disappear from circulation. Under the Coinage Act of 1965, Congress eliminated the use of silver in coins and authorized the mining of cupro-nickel substitutes and the sale of silver to the public. The right of holders of U.S. silver certificates to redeem them for silver was suspended in 1968. The following year, a federal ban on the melting of U.S. coins was lifted, freeing anywhere from 400 to 700 million ounces for secondary recovery.Read more...

And the report here