


Silver first traded hesitantly then followed gold and gained nicely, the days of single digit silver will soon be history.
The gold and silver markets simply present an extremely high reward low risk Investment opportunity. In the long term I expect the price of gold and silver to multiple several times, gold can easily reach four digit figure and possibly 5 figure, while silver can reach high double digit and possibly low three digit figure.
See the hedge book report for detailed analysis regarding one segment of the short gold positions. click here to open the report in a new window.
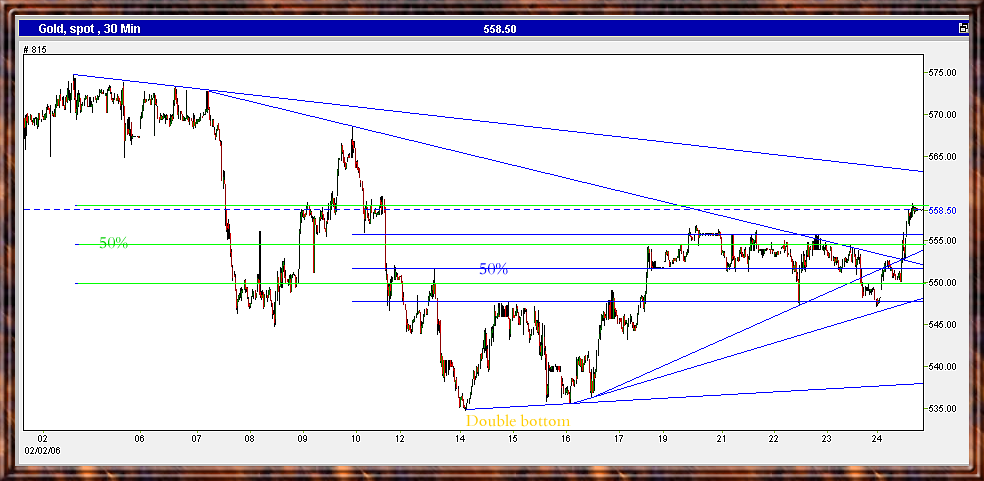
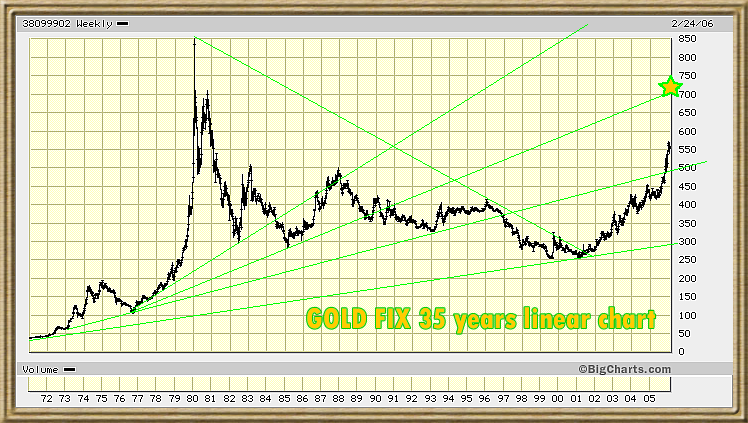
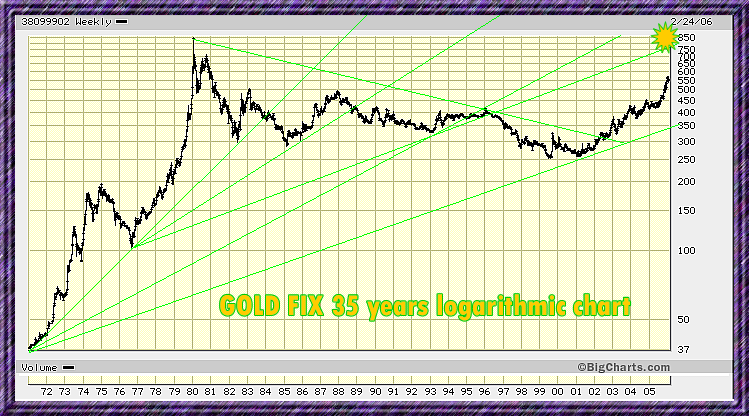
Click on the charts below to enlarge:
Feel free to quote, copy or link.

No comments:
Post a Comment