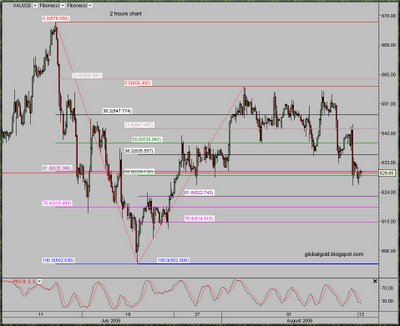
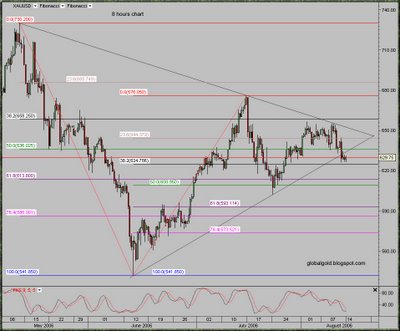
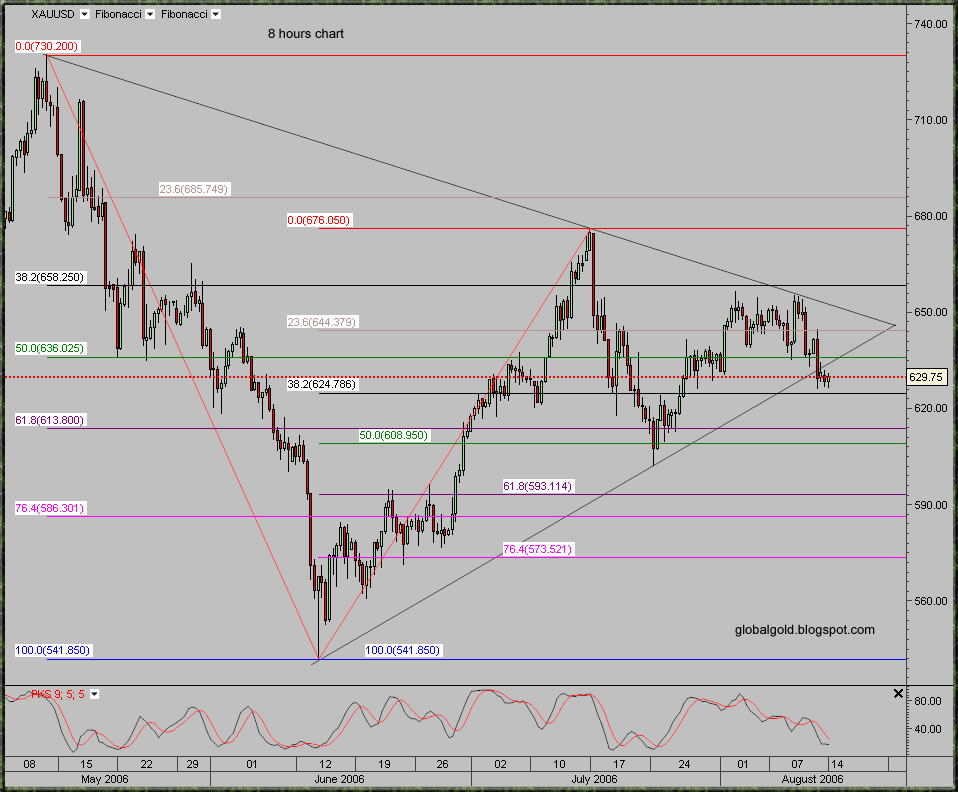
Below are two intraday charts of spot gold, each with two sets of Fibonacci lines and stochastic indicator. Gold broke down from the triangle formation, it's a head fake in my opinion and I did mentioned this possibility
here.
Click on the charts below to enlarge


No comments:
Post a Comment