


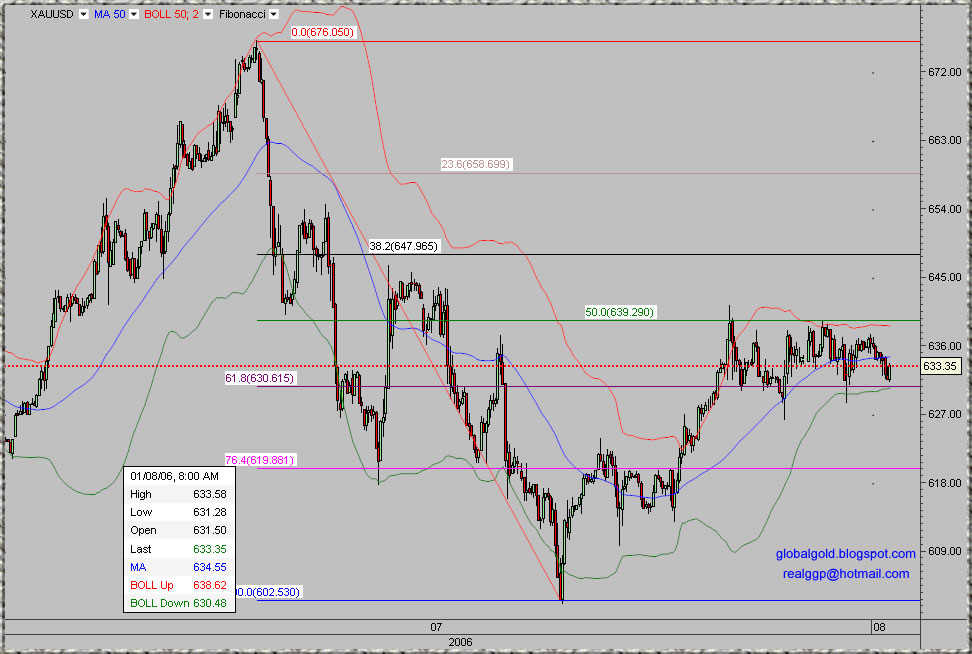
As you can see on the one hour spot gold chart below, the price of gold is trading between the 61.8% and the 50% Fibonacci lines (630$ - 640$). More support at ~620$(76.4%) and resistance at 648$(38.2%). As for the longer term picture for gold – No change and no need to update the daily and weekly charts I posted several times during the last week or so. (See the archive).
Click on the chart below for larger view.

No comments:
Post a Comment