


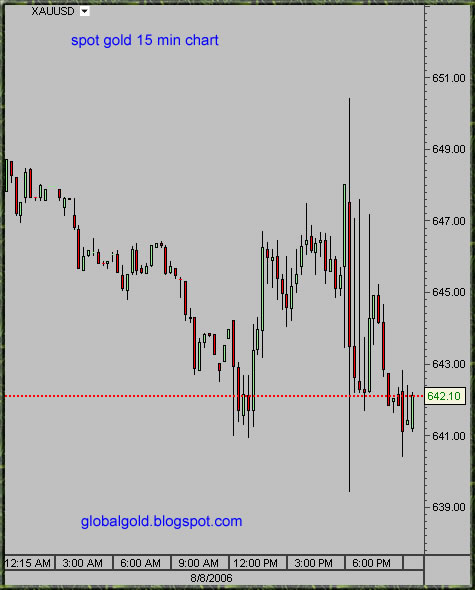
The gold market reacted with modest rally, somewhat abnormally but certainly not surprising - gold immediately sold off and traded at the low for the day.
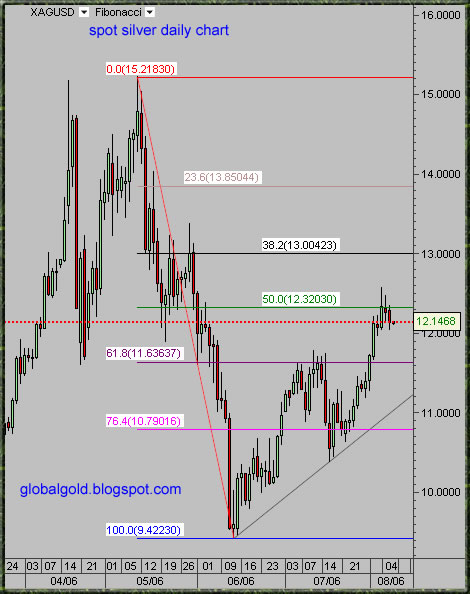
Looking at the daily chart, Same Elliott wave count, this is wave (iii of III), triangle formation which will break to the upside in my opinion and result in a spectacular rally. Notice that gold can go to 630$ and the formation will still stay valid, It is also possible that gold will first break down (head fake). Silver will follow gold and can sometimes lead.
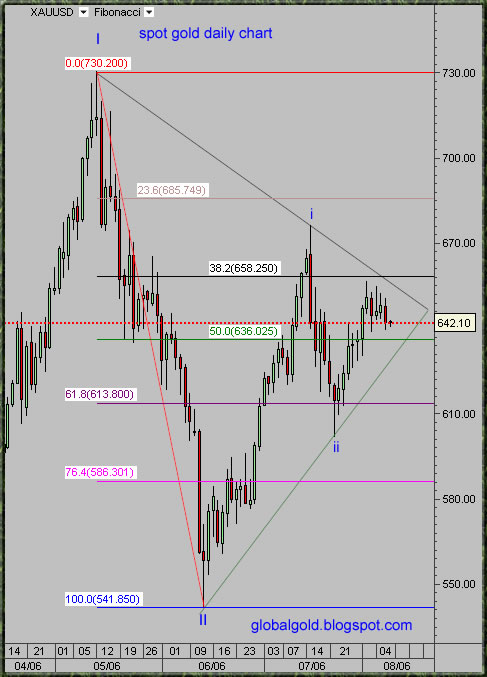
All in all a little bit more consolidation is possible but gold will head higher quite soon. Those of you who do not trade gold on an intraday basis can safely accumulate at current price and average up or down.
During Bull markets, for conservative positions - perfect timing is not as important as consistency and patience . On the other hand – for aggressive long positions and short positions of all kinds – Timing is everything!
Q2 2006 Gold Hedge Book Report
This 30 page report by: Mitsui Global Precious Metals, Haliburton Mineral Services, and Virtual Metals Research & Consulting. – Unique in depth analysis of the gold miners hedge positions. - Link

No comments:
Post a Comment