


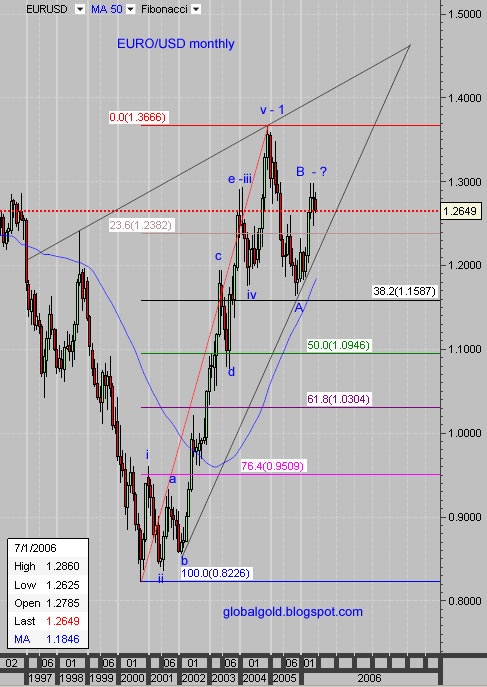
Please note that theoretically the EURO was as high as 1.45 USD at 1992, since then it didn't manage to make a new high.
Monthly chart shows a triangle pattern with a price objection of 1.45 by early 2009. I see a significant top labeled (v – 1) and then A correction wave to the 38.2% Fibonacci line. B top might be in place and if that’s the case - C low (lower then A) should be expected.
Weekly chart – more detailed wave count, currently just around the 50% Fib, the wave count further indicating a completion of a B top.
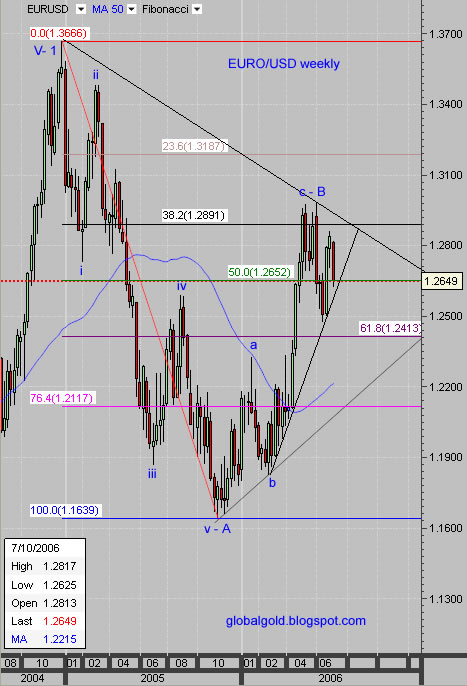
According to my Elliott wave analysis the outlook is short term bearish and long term natural to slightly bullish. A rate exchange of 1:1 (par) will not surprise me.
Related:
Gold Vs. X.
