


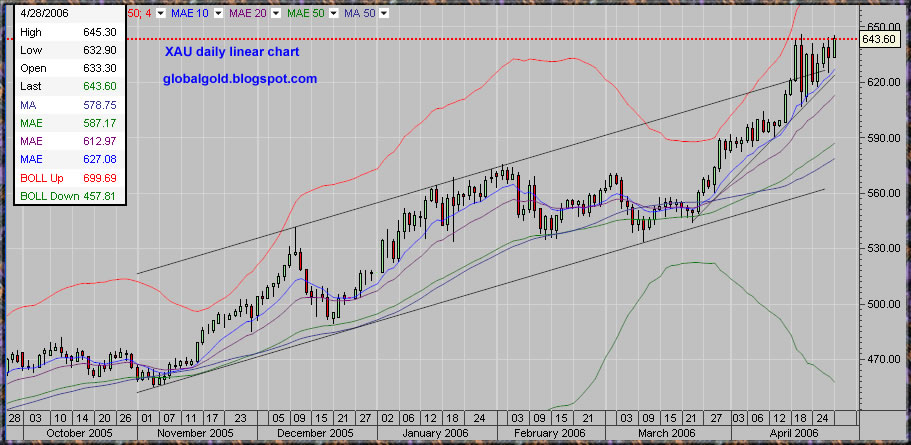
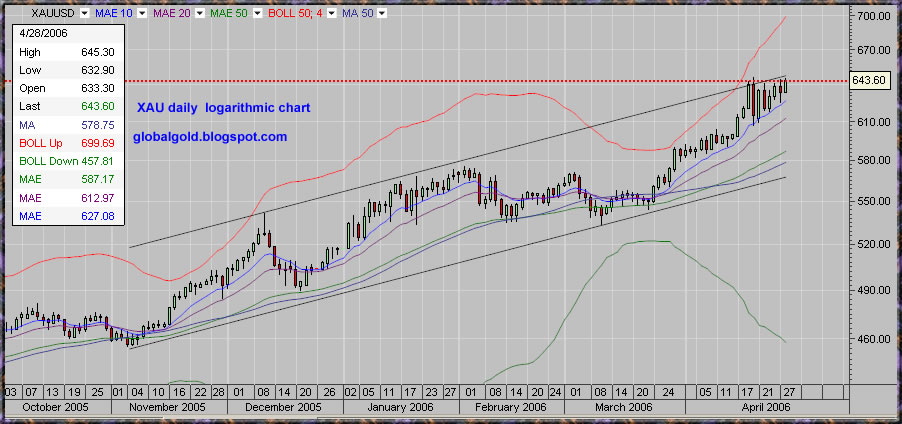
As for the technical picture, here are two daily gold spot (XAU) charts with exactly the same settings (Channel, EMA, MA & Bollinger Bands). The only difference, the first one is a linear chart while the second one is logarithmic. The linear XAU chart shows that gold is trading above the previous upper diagonal channel trend line. The logarithmic gold chart shows that gold is trading just below the same diagonal line. The reason for this is the fact that as the price of gold is accelerating the difference between measuring the price of gold in terms of percentage vs. nominal is more significance. This makes the use of linear trend lines more complex and EMA might be used to give a better exponential / non linear perspective.
Silver ETF , symbol SLV is issued today (AMEX) and since the Silver ETF IPO is widely expected and the price already corrected it should be a non event.
First U.S. Silver ETF Launches Friday A.M.By: Dorothy Kosich
Posted: '27-APR-06 23:00' GMT © Mineweb 1997-2004
RENO--(Mineweb.com) As the first U.S. Silver ETF is officially launched by Barclays Global Investors Friday morning, Silver Institute President Phil Baker, the Chairman and CEO of Hecla Mining, told Mineweb that he views it as a positive move that will, ultimately, generate more interest in silver equities.
Michael DiRenzo, Executive Director of the Silver Institute, noted that the "this investment vehicle will give a wide range of investors the opportunity to diversify their portfolio to silver."
Christine Hudako of Barclays confirmed to Mineweb Thursday that the silver ETF will launch Friday morning on AMEX under the name iShares Silver Trust, (SLV). Earlier this week, Barclays deposited 1.5 million ounces of silver with the JP Morgan Chase Bank to back its 150,000 ETF shares. Each share is equivalent to 10 ounces of silver. source
Platinum long term charts , HUI – Amex Gold Bug Index E – Waves

No comments:
Post a Comment