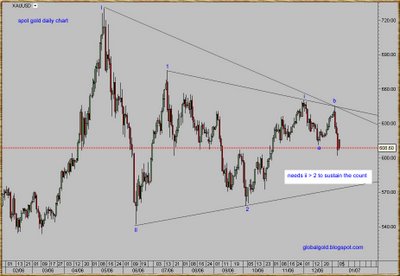
Gold begins 2007 with sharp rapid decline to level not seen since October 2006. Looking at the uptrend line connecting the June and October lows it's easy to see that gold can go to 570's $ and the uptrend can still be intact . According to my Elliott wave count (June 2006 is a major low) gold can go as low as 560$ and the count will still stay unchanged (bullish). For relevant Fibonacci levels refer to previous posts. Click on the chart below for larger view. For Elliott wave basics see this tutorial.


No comments:
Post a Comment