


Here is an interesting site that collect eBay gold and silver auction data.
http://www.24hgold.com/english/buy_sell_gold_coins.aspx
Premiums over spot are high to say the least.
Friday, December 05, 2008
Sunday, November 02, 2008
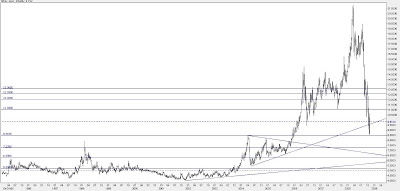
Gold and Silver Charts
September bottoms failed to hold for both gold and silver. The price of Gold made a new bottom at around 681$ for spot gold. The price of spot silver traded as low as 8.47$.
Gold support and resistance zones: 541$, 559$, 607$, 638$, 681$ <> 744$, 772$, 845$, 930$, 988$,1032$

Silver support and resistance zones: 5.20$, 6.30$, 7.23$, 8.46$<> 11.03$, 12.02$, 12.59$, 13.07$, 13.73$, 16.48$, 19.44$, 21.34$.
Gold support and resistance zones: 541$, 559$, 607$, 638$, 681$ <> 744$, 772$, 845$, 930$, 988$,1032$

Silver support and resistance zones: 5.20$, 6.30$, 7.23$, 8.46$<> 11.03$, 12.02$, 12.59$, 13.07$, 13.73$, 16.48$, 19.44$, 21.34$.

Monday, September 29, 2008
Gold chart update
Between March and September[2008] the price of gold declined almost 300$ (1032$ - 736$), So far thats the biggest decline both in nominal and percentage terms – since the global gold bull market had begun. At the same time the price of Silver declined more then 50% (21.34$ - 10.24$).
However, as both gold and silver reached some kind of cyclical bottom a sharp rally then followed:
gold 179$(736$ - 915$) and silver 3.51$(10.24$ - 13.76$).
Currently gold is trading around 877$ and silver 13.20$.
Despite or given the recent extreme volatile price action it is likely that an important cyclical bottom is in for the price of gold and silver.
Gold support and resistance : ~736$, ~831$ <> ~905$, ~988$, ~1032$.

Tuesday, September 02, 2008
GGP Update
Recent downward action is similar to 2006 action , this time the pressure in the markets is probably more severe but there are lots of price action similarities, just do the calculations. Honestly, I do think that gold can go lower in the short to medium term if market pressure continue but over the longer term I do think that much higher rates might be coming.
Thats all for now.

Thats all for now.

Sunday, August 03, 2008
Gold Chart Update (XAUUSD)
Previous week action:
Gold traded between ~893$ and ~934$ which is a 41$ trading range for the week.
Open = 928$ and close 910$, third red candle in a row.
However, gold did not trade below or above any significant low or high.
Cyclical resistance zones: July 15 high of ~988$ and March 17 high (all times high) ~1032.20$.
Cyclical support zones: 12 Jun Low of ~857.45$ May 2 low of ~845.50$.
Pivot zone : ~912$
Currently the most active contract is December gold futures (GCZ8 / ZGZ8 / YGZ8)
Gold spot 8 hours linear chart

Subscribe to:
Posts (Atom)
