Monday, September 29, 2008

Gold chart update

Between March and September[2008] the price of gold declined almost 300$ (1032$ - 736$), So far thats the biggest decline both in nominal and percentage terms – since the global gold bull market had begun. At the same time the price of Silver declined more then 50% (21.34$ - 10.24$).

However, as both gold and silver reached some kind of cyclical bottom a sharp rally then followed:

gold 179$(736$ - 915$) and silver 3.51$(10.24$ - 13.76$).

Currently gold is trading around 877$ and silver 13.20$.

Despite or given the recent extreme volatile price action it is likely that an important cyclical bottom is in for the price of gold and silver.

Gold support and resistance : ~736$, ~831$ <> ~905$, ~988$, ~1032$.

gold spot weekly chart

Tuesday, September 02, 2008

GGP Update

Recent downward action is similar to 2006 action , this time the pressure in the markets is probably more severe but there are lots of price action similarities, just do the calculations. Honestly, I do think that gold can go lower in the short to medium term if market pressure continue but over the longer term I do think that much higher rates might be coming.

Thats all for now.

gold chart

Sunday, August 03, 2008

Gold Chart Update (XAUUSD)

Previous week action:

Gold traded between ~893$ and ~934$ which is a 41$ trading range for the week.
Open = 928$ and close 910$, third red candle in a row.

However, gold did not trade below or above any significant low or high.

Cyclical resistance zones: July 15 high of ~988$ and March 17 high (all times high) ~1032.20$.

Cyclical support zones: 12 Jun Low of ~857.45$ May 2 low of ~845.50$.

Pivot zone : ~912$

Currently the most active contract is December gold futures (GCZ8 / ZGZ8 / YGZ8)

Gold spot 8 hours linear chart

Gold spot intraday chart

Sunday, July 27, 2008

Gold Spot Update

Cyclical resistance zones: July 15 high of ~988$ and March 17 high (all times high) ~1032.20$.

Cyclical support zones: 12 Jun Low of ~857.45$ May 2 low of ~845.50$.

Pivot zone : ~912$

Gold spot 8 hours chart (OHLC)

Gold spot 8 hours chart

Sunday, July 20, 2008

Long term currencies charts

Long term currency perspective , monthly charts:


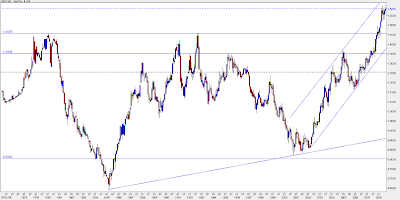
Euro / US Dollar, EUR/USD 32 years chart – partly synthetic


EUR/USD

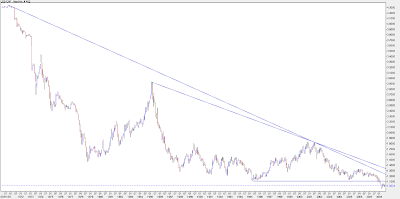
Japanese Yen, USD/JPY 33 years chart


USD/JPY

British Pound, GBP/USD 38 years chart


GBP/USD


Swiss Franc, USD/CHF 38 years chart


USD/CHF

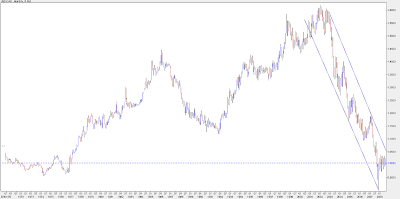
Canadian $, USD/CAD 38 years chart


USD/CAD

Australian $, AUD/USD 18 years chart


AUD/USD

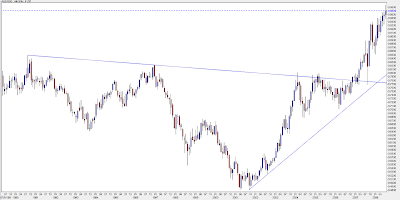
Gold 37 years chart

Gold