Thursday, May 31, 2007

Few Notes

  • There is probably an ongoing gold &silver options repositioning.
  • Gold / oil ratio should continue to move up (15).
  • Gold / silver ratio, many traders are probably taking this trade , not that wise especially for small or big trades, mid size can do better.
  • XAU, HUI indices seem to confirm the turn.
  • Trading continues to be internally technical.
  • If I read the chart correctly 680 shouldn't be very difficult for start.
  • The downtrend is dead, long live the uptrend.

Wednesday, May 30, 2007

XAUUSD Waves Update

Dear readers,

Gold have probably bottomed and in time will be headed higher to challenge recent highs at 700 U$D / 520 € / 83,000 ¥. Silver confirms this assumption and the silver /gold ratio shows relative strength.

Elliott Waves Cyclical view: The advance from the recent low consist of multiple sequences of intraday impulsive 5 waves patterns (visible on minutes charts). Despite the recent failed (v)[green] wave within the last (i) [blue] wave, the previous bullish Elliott wave count remains intact .

The count on the chart below is consisted of multiple first and second waves which are typical for extended third of the third waves. If the count is valid then the lion part of the advance is yet to be seen. I see no reason to mention upside target for now, as, the 700 $ level along the Euro and Yen targets need to be challenged first.


Again, Forex and Metals traders should note the possibility that gold and silver can go up along a rising USD index. (See chart here)

Strategy: buy pullbacks as long as spot silver above 12.37$ and gold spot above 632$.


XAUUSD (spot gold) daily chart


XAUUSD Chart

Thursday, May 24, 2007

ZG, GC & Spot Charts update

Gold options expire, futures contracts are rolled over (June to August), Statistics coming in at 8:30 and 10:00 AM. Technically the market is extremely indecisive and market participants wouldn't want to be heavily committed.

Elliott Wave update will be coming as soon as the picture gets a little bit clearer.

ZGM7 CBOT Gold Intraday (120 minute) chart

CBOT Gold


GCQ7 COMEX Gold daily chart

COMEX Gold


XAUUSD (spot gold) daily chart

XAUUSD

Monday, May 21, 2007

Elliott Wave Principle

Dear readers,

Gold and silver caught some bids today and closed higher along a rising US dollar. Those of you who have been following my posts were certainly not surprised.

Some readers have emailed me with questions like: how do I make my gold price predictions (which are often very accurate) and what technical indicators I use for trading?

Well, I look at many different things: price & volume action, chart patterns, candle sticks, Fibonacci levels, moving averages, PPO, RSI, Stochastic, Inter market relationships, market sentiment and more. But above all cyclical analysis, namely Elliott wave analysis.

Elliott wave analysis is far from being a perfect tool (what is perfect?) However, as regards to making predictions Elliott waves counting when combined with other market indicators is the most valuable tool in my opinion.

Once you understand how the wave principal works, you will learn to respect the market opinion, you will stop looking for reasons to explain why the market is doing this or that. You will learn to accept the cyclical nature of waves.

One excellent book for learning wave analysis is: Elliott wave principle by Frost & Prechter.

By the way, I'm currently reading Prechter's latest book: How to Forecast Gold and Silver Using the Wave Principle. This 483 page book is an amazing documentary which aggregates all of the author gold and silver real time analysis between 1979 -2001.

I will post a more detailed review once I finish reading this book. For now I would just say that while Prechter is usually known for his bearish predictions, I was very surprised to read about some extremely bullish price objective for gold that might still be valid today.
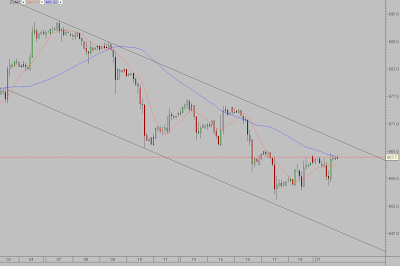


Short term technical update:

The price of gold is still inside the downtrend channel.


ZGM7 – CBOT June Gold Intraday (120 minutes) chart


ZG (cbot gold) chart

Wednesday, May 16, 2007

Gold Channel Chart

The action today give the USD index a green light to go higher, don’t be surprised to see the Dollar index climbing higher for days, weeks and maybe several month.

As far as gold is concerned it is certainly possible that strengthening USD index will have less downside affect on the price of gold, but that remains to be seen.

For Fibonacci levels refer to the previous XAUUSD daily chart.

As always be cautious.


ZGM7 – CBOT June Gold Intraday (120 minutes) channel chart