


Sunday, July 30, 2006
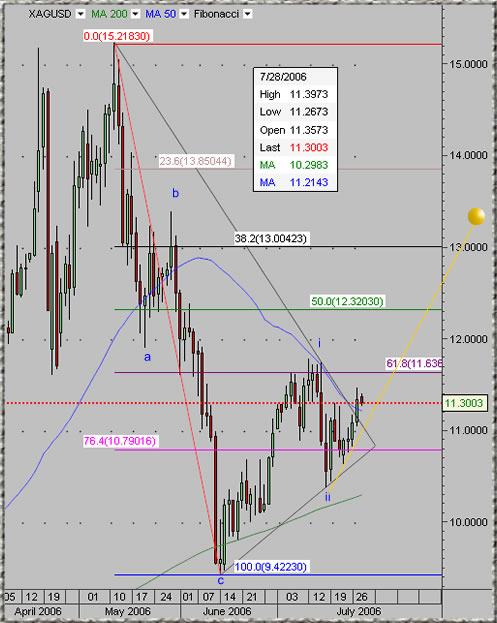
Spot Silver Daily Chart
Like gold, silver recently had serious a-b-c correction wave (15.21$ - 9.42$). Silver bottomed below its 200 DMA, rallied to the 50 DMA (wave i) then pulled back slightly (wave ii).Recently silver succeeded to close above the downward diagonal line connecting the May top and the wave (i) top. Currently the price of silver is above the 50 DMA. In my opinion- silver along gold is headed much higher with good chance for accelerated rally coming quite soon.

Saturday, July 29, 2006
Off Topic - Who visit this Blog ?
Some statistical information regarding this blog visitors.
Data since December 20 , 2005 :
1) 92,119 Visits for a total 230,469 page views. About 55% of visits are returning visitors and 45% new visitors.
2) Geographic location: 55% of visitors from the United States the rest are coming from 99 other countries. Other then the USA most visitors are coming from: Canada, United Kingdom, Singapore, Australia, Hong Kong, Germany, Thailand, Israel, India and Italy.
3) Among visitors are hedge fund managers, speculators, physical buyers, international banks employees and academics.
4) Technical details:
Operating System: 95% using the windows platform, 4% using Macintosh, 1% UNIX systems.
Browsers: 71% are using Internet Explorer, 23% using FireFox , 6% other browsers.
Screen Resolutions: 50% - 1024x768, 16% - 1280x1024, 13% - 800x600 and the rest – 21% are mostly using various higher resolutions.
Friday, July 28, 2006
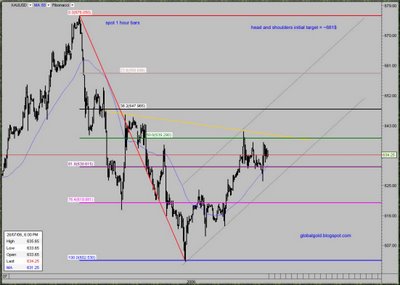
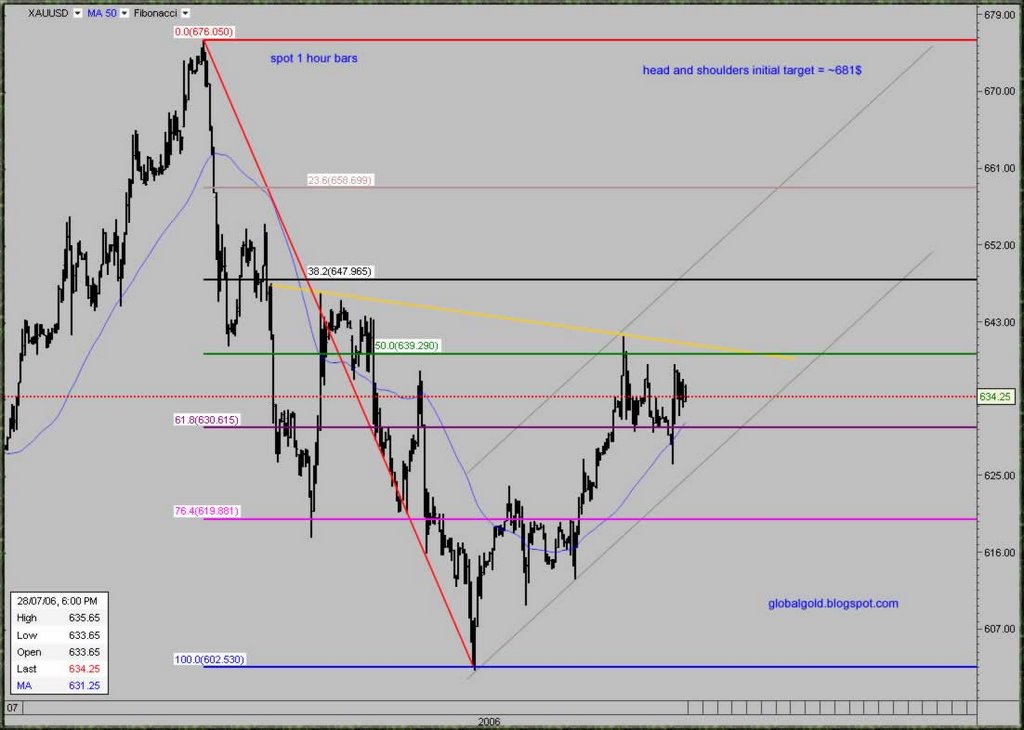
Spot Gold Chart
It was a good week for gold despite the futures market rollover shenanigans. Spot gold traded between 603$ and 641$. The price of gold is quick to recover the recent slump, in my opinion value buyers are quietly accumulating. I didn't notice any important news regarding gold and the price behavior is technically normal.
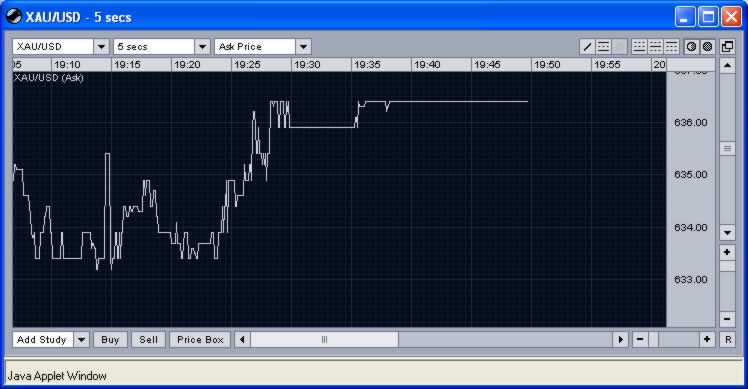
Just before the close of the COMEX trading I noticed an unusual temporary up tick on the spot market – about 2.2$. See the 5 seconds chart below..
If you look closely on the intraday 1 hour chart you can observe potential inverted head and shoulders pattern with initial price target of 681$. Click on the charts below for larger view.
I will post more charts over the weekend.
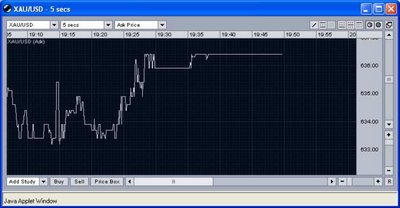
Thursday, July 27, 2006
Intraday Gold Chart Update
Gold surprised me on the upside today, climbing more then expected. But currently the price of gold is back inside the range I indicated (633$ - 618$). Don’t read me wrong, I fully expect gold to move much higher then 633$ and quite soon.
Russia's gold and currency reserves up $7.2 bln in week
MOSCOW, July 27 (RIA Novosti) - Russia's gold and foreign currency reserves grew by $7.2 billion to $262.9 billion as of July 21 from $255.7 billion a week earlier, the Bank of Russia said Thursday. -source
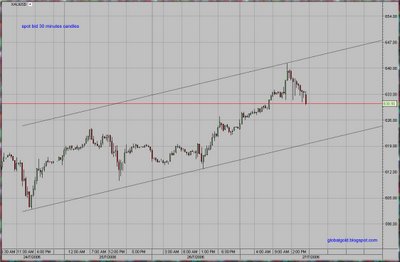
Below is an intraday spot gold channel chart, hopefully this one holds for more then 2 hours. If this channel holds, gold will trade between 620$ to 647$ during the next 24 hours. Click on the chart for enlarged view.
Russia's gold and currency reserves up $7.2 bln in week
MOSCOW, July 27 (RIA Novosti) - Russia's gold and foreign currency reserves grew by $7.2 billion to $262.9 billion as of July 21 from $255.7 billion a week earlier, the Bank of Russia said Thursday. -source
Below is an intraday spot gold channel chart, hopefully this one holds for more then 2 hours. If this channel holds, gold will trade between 620$ to 647$ during the next 24 hours. Click on the chart for enlarged view.

Subscribe to:
Posts (Atom)
