Wednesday, January 04, 2006

Gold & Silver 4 hours charts

Some intraday consolidation for gold and silver, Still very strong action and up trends lines in place.

Click on the charts below to enlarge :


gold price
silver chart

Gold 8 hour chart

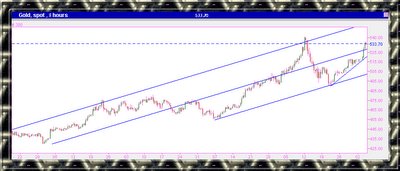
It was an excellent new year start for gold , silver and their indices. The 8/24 hours gold spot chart is annotated with a 3 parallel lines to make it easier to see where things are probably headed and what performance one should expect from the Forex of nature.
In the future I might post some gold and silver stocks charts but I want to warn you that the stocks tough can and do outperform the physical stuff are very different from the metal itself for obvious reasons.
So is the futures, cfds , options , derivatives ..etc- which are all paper gold instruments and under some circumstances could be defaulted .


Gold intraday chart

Tuesday, January 03, 2006

Gold daily 6 month chart

Very nice move for the Forex of nature. Not much news , simply bullish action.

click on the chart below to enlarge.

gold chart

Gold 60 minutes chart

Many Traders and Investors are waiting on the sidelines to get into gold; some of them are waiting for a better price or got stuck with the wrong Elliot wave count. This is exactly the reason why we aren’t likely to see any correction soon. The climb from the 489 $ bottom is very strong and a nice triangle pattern was built. Gold might register a new high very soon.

Click on the chart below to enlarge.


gold spot chart

Sunday, January 01, 2006

Silver 2005

Not much to say, it was an excellent year for silver. As the price of gold is moving higher silver will follow and might lead. Small physical buyers who can’t afford gold will often go and buy silver.

Click on the chart below to enlarge a 1 year silver price chart


silver chart