The priced of gold bounced from the 680's $ support area. Cyclical support and resistance areas : 680$, 745$, 772$, 845$, 930$, 988$, 1032$. Gold spot ten years weekly chart anotated with support resistance and trend lines
September bottoms failed to hold for both gold and silver. The price of Gold made a new bottom at around 681$ for spot gold. The price of spot silver traded as low as 8.47$.
Gold support and resistance zones: 541$, 559$, 607$, 638$, 681$ <> 744$, 772$, 845$, 930$, 988$,1032$
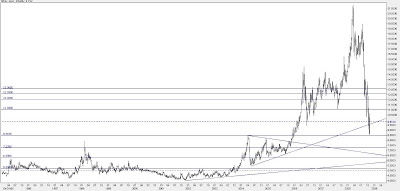
Silver support and resistance zones: 5.20$, 6.30$, 7.23$, 8.46$<> 11.03$, 12.02$, 12.59$, 13.07$, 13.73$, 16.48$, 19.44$, 21.34$.
Between March and September[2008] the price of gold declined almost 300$ (1032$ - 736$), So far thats the biggest decline both in nominal and percentage terms – since the global gold bull market had begun. At the same time the price of Silver declined more then 50% (21.34$ - 10.24$).
However, as both gold and silver reached some kind of cyclical bottom a sharp rally then followed:
gold 179$(736$ - 915$) and silver 3.51$(10.24$ - 13.76$).
Currently gold is trading around 877$ and silver 13.20$.
Despite or given the recent extreme volatile price action it is likely that an important cyclical bottom is in for the price of gold and silver.
Gold support and resistance : ~736$, ~831$ <> ~905$, ~988$, ~1032$.
Recent downward action is similar to 2006 action , this time the pressure in the markets is probably more severe but there are lots of price action similarities, just do the calculations. Honestly, I do think that gold can go lower in the short to medium term if market pressure continue but over the longer term I do think that much higher rates might be coming.