


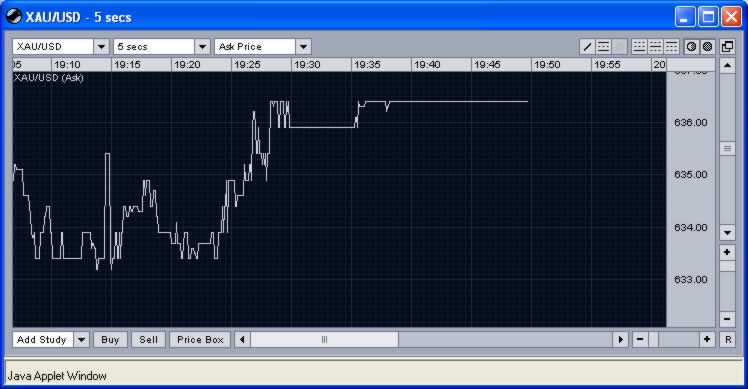
Just before the close of the COMEX trading I noticed an unusual temporary up tick on the spot market – about 2.2$. See the 5 seconds chart below..
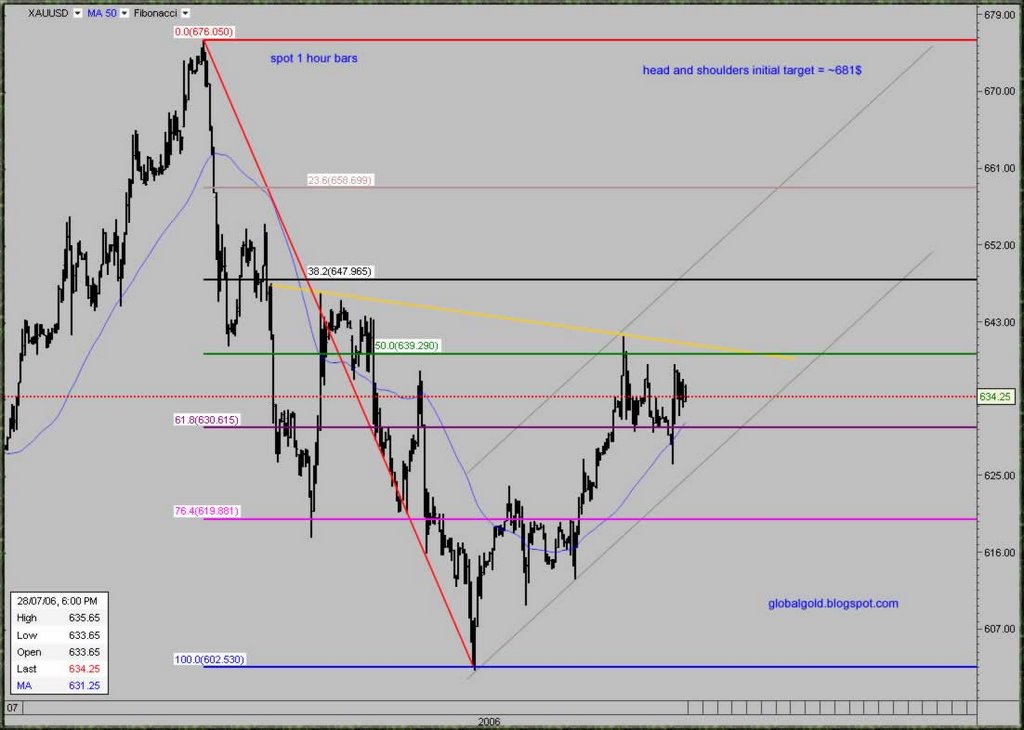
If you look closely on the intraday 1 hour chart you can observe potential inverted head and shoulders pattern with initial price target of 681$. Click on the charts below for larger view.
I will post more charts over the weekend.

2 comments:
Hi - a great site which i read avaidly with interest! Often very accurate predictions ... well done !
What is the relevance of the temporary updide tick of 2.2 usd in the minutes before clsoing that you mentioned ?
Since I noticed this up tick on several quoting systems, it might mean a relatively large spot market transaction. Friday is usually a low volume day so this should be also taken into account. Overall don't read too much into it, but I did notice it and decided to share it with readers.
Post a Comment