Showing posts with label COMEX. Show all posts

Sunday, August 03, 2008

Gold Chart Update (XAUUSD)

Previous week action:

Gold traded between ~893$ and ~934$ which is a 41$ trading range for the week.
Open = 928$ and close 910$, third red candle in a row.

However, gold did not trade below or above any significant low or high.

Cyclical resistance zones: July 15 high of ~988$ and March 17 high (all times high) ~1032.20$.

Cyclical support zones: 12 Jun Low of ~857.45$ May 2 low of ~845.50$.

Pivot zone : ~912$

Currently the most active contract is December gold futures (GCZ8 / ZGZ8 / YGZ8)

Gold spot 8 hours linear chart

Gold spot intraday chart

Sunday, June 29, 2008

Gold Price Analysis


22 – 27 June 2008 August Gold (COMEX GCQ8 , CBOT ZGQ8 & YGQ8)


August gold future contracts ranged 56$ (~877$ - ~933$). Gold begun the week on the weak side (price did not make a lower low vs. previous week) but finished rather strong.

Support zones for GCQ8 : 875$ , 860$, 850$ and lower.

Resistance zones for GCQ8: 940$, 960$ - 964$ and 1041$.

August gold futures (GCQ8) 8 hours chart

comex gold future chart


Note: Gold / Crude oil ratio at historic lows

Sunday, June 01, 2008

August Gold (GCQ8)

Currently the Comex August 100 oz gold future is the most active contract (GCQ8) , open interest for this contract is 257,894 according to NYMEX website.

GCQ7 topped at 03/17/2008 @ 1039.8$ and recently bottomed at 05/02/2008 @850.5$. The trading range this year was ~190$ so far.


Since the 05/02/2008 bottom gold managed to climb ~90$ but then pulled back and lost most of the gain.

Support zones for the GCQ8 contract : ~871$, ~864$, ~850$.

Resistance zones for GCQ8 : ~940$, ~960$, ~964$, ~1040$.


Once this ~190$ trading range is violated refer to the logarithmic weekly gold spot chart below for potential targets and support resistance zones.


GCQ8 August gold contract - 8 hours linear Fibonacci chart


GCQ8 chart

XAU/USD - gold spot weekly log Fibonacci chart


Gold weekly chart

Monday, May 12, 2008

Gold short term technical update

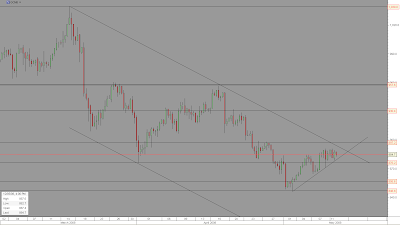
From mid March to early may the price of the Comex June gold contract (GCM8) pulled back about 190$ (1038$ > 846$) currently trading around 885$ . Along gold recent weakness there is some USD strength vs some of the other popular currencies such as the Euro , Yen , British pound, Swiss frank and others.

The trend is still down ( as defined by the diagonal line connecting the major top (1038$ at mid March) with the secondary top (~956$ at mid April), But there is a minor uptrend inside that bigger down trend channel which give some chance for the 846$ bottom to hold.

Support levels : diagonal minor trend line , ~876$, ~856$, ~846$, ~817$, ~792$

Resistance levels : diagonal downtrend line, ~897$, ~913$, ~930.5$, ~957.5$, ~977$, ~1039$.

June Comex gold futures (GCM8) 8 hours chart

gold comex chart

Sunday, April 27, 2008

Gold futures (GCM8) and silver (xagusd) technical update

Gold is down trending and aiming to break support at first April low (876.5$ for GCM8). The price of gold failed to penetrate the 50% Fibonacci resistance at 957.54 and selling pressure pushed the price lower.

Resistance at diagonal upper trend line, ~906.5$ , ~938$ (38.2%Fibonacci) , ~976$ (61.8% Fibonacci) , ~1003$(76.4% Fibonacci) and the high of 1038$.


Support at 876.5$ ,~860, 850$ -840$ , ~820$, 792$, ~750$.


June Comex gold futures (GCM8) 8 hours chart


Gold spot weekly chart


<br />XAUUSD weekly chart


Silver
is down trending as well and already lost 5$ from its top at 21.33$ (spot price)


Silver Spot weekly chart


Silver (XAGUSD) weekly chart

Sunday, April 20, 2008

Short term technical update (GCM8)

The bulls had a few moments of grace as the price of gold managed to trade above the diagonal trend line resistance, but gold failed to penetrate the secondary top at ~960$ and pulled back ~50$.

resistance around ~938$ (38.2% fibo) , ~976$ (61.8% fibo) , ~1003$(76.4% fib) and the high of 1038$.

support at ~888$, 876.5$ 850$ -840$ , ~820$, 792$.

All price relating to Comex gold June contract (GCM8)

comex gold chart

Tuesday, December 25, 2007

Gold OTC derivatives

Total OTC derivatives are up from ~414 trillion to ~516 trillion for notional amounts outstanding (+24.6%) and up from 9.682 trillion to 11.140 trillion at gross market values (+15%).

Gold OTC derivatives are actually down from 0.640 trillion to 0.426 trillion for notional amounts outstanding (-33.4%) and from 56 billion to 47 billion at gross market values (-16%).

Gold OTC derivatives are still just a tiny part of total OTC derivatives (less then 0.1% for notional value and a~0.42% at gross market values)

The decline of gold OTC derivatives is probably a direct result of:

1) De-Hedging by gold producers.
2) Market participants move their business from OTC derivatives into more liquid, transparent and regulated markets such as COMEX (GC) and CBOT (ZG).

You can see the BIS OTC derivatives report here

Sunday, October 28, 2007

GCZ7 Chart (Comex Gold)

Dear readers,

The trend is simply (still) up until it isn't. The move is extended and as the price keeps climbing the risk for a sharp sell off is also increasing. But for now after a modest ~25$ correction gold quickly recovered and made a new high. The trend (since August) support is currently coming at ~758$ . From an Elliott wave perspective (according to my count and understanding )support is at 749$ & 726.5$. Trend resistance at 803$ and climbing. More resistance at round numbers, contract highs , all times highs and Fibonacci targets.


thats all for now...

GCZ7 8 hours linear chart.

comex gold

Tuesday, July 24, 2007

GCQ7 Update

Dear readers,

This will probably be the last GCQ7 chart as gold futures contracts are rolled into December and October (GCV7, GCZ7).

Hype is all over the place so sentiment indicator probably supports the case for some correction here, As previously mentioned USD is trying to bounce.


August Gold - GCQ7 Intraday (120 min) Chart

August Gold

Tuesday, July 17, 2007

Gold and Silver Charts

Dear readers,


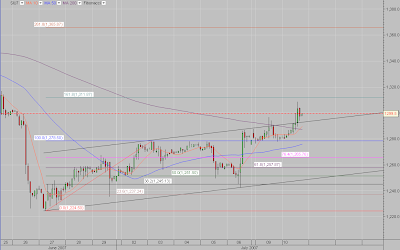
Yet again, minor consolidation might be over; gold and silver should be ready to move higher. Just my opinion, only the time will tell.


(SIU7) COMEX September Silver Intraday Chart (2 hours sticks)

comex silver chart


(ZGQ7) CBOT August Gold Intraday Chart (2 hours sticks)

cbot gold chart

Thursday, July 12, 2007

GCQ7

Gold, Silver, Platinum & Palladium all up on the day.

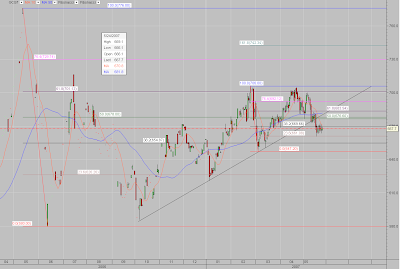
Two hours sticks chart of COMEX August gold contract looking very similar to the COMEX September silver chart I posted two days ago.

comex gold

Tuesday, July 10, 2007

XAU, XAG & Forex Commentary

Not much change in the USD price of gold (xauusd) today. Gold futures traded and closed slightly higher but priced in Euro and Yen gold is actually down today.

The Euro made a new all time high vs. the USD, EURUSD ~= 1.3740. Note that pre issued Euro high was EURUSD 1.4750, Long term (30 years) retro perspective EUR/USD chart.

Marginal carry traders capitulated as the Yen rallied strongly. Be careful with that one! , Seems like the carry trade become way over crowded as every one and his dog doing the thing.

Silver
up, the high of the day was 13.085 for SIU7 (COMEX September contract)

Silver SIU7 Intraday Chart (2 hours sticks)


Silver COMEX chart

Friday, June 15, 2007

Switzerland gold sell ?!

The sell if they will isn't as meaningful as the reporter wants you to believe. Consider that the outstanding notional amount of gold over the counter derivatives is 463 billion USD , reported by the BIS December 2006.


Switzerland's central bank is to sell a further 250 tonnes of gold, dashing hopes for a revival in depressed bullion prices after months of heavy selling by Spain and Belgium.


The Swiss National Bank is world's fourth biggest holder of gold after the European Central Bank system, the United States, and the IMF. Most analysts thought it had stopped selling its horde after a 1,300 tonne "purge" between 2000 and 2004,

The SNB said yesterday it would feed a fifth of its remaining gold onto the market gradually between now and September 2009 as part of a rejigging strategy for its reserves.

source


COMEX gold contract for December 2009 is currently priced at about 750$


2009 comex gold chart

Thursday, May 24, 2007

ZG, GC & Spot Charts update

Gold options expire, futures contracts are rolled over (June to August), Statistics coming in at 8:30 and 10:00 AM. Technically the market is extremely indecisive and market participants wouldn't want to be heavily committed.

Elliott Wave update will be coming as soon as the picture gets a little bit clearer.

ZGM7 CBOT Gold Intraday (120 minute) chart

CBOT Gold


GCQ7 COMEX Gold daily chart

COMEX Gold


XAUUSD (spot gold) daily chart

XAUUSD

Tuesday, May 08, 2007

Gold Charts

Technically there is not much change… The uptrend on the daily chart is intact.

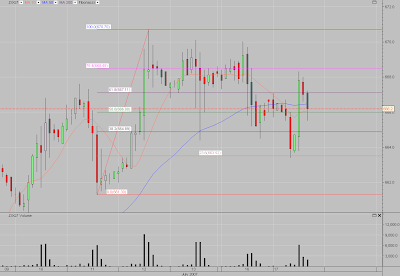
COMEX June gold (GCM7) daily chart- the price is still between the 50 %( 672.50$) and the 61.8 %( 695.8$) Fibonacci levels.


COMEX gold


CBOT June gold (ZGM7) intraday (120 minutes) chart – the price recently bottomed at 670.1$ and again at 684.1$ today. Bottom to top and top to bottom short term Fibonacci levels are added.

CBOT gold

Friday, May 04, 2007

Intraday Wave v underway but ...

Dear readers,

The gold market showed strength in the face of rising USD Index. This fact which probably surprised some traders - will be very useful at a later stage of this gold global bull market.

Technically, as the price of gold broke above the short term downtrend line the bottom was confirmed. Gold then spent some time back testing the downward slope line and then headed higher. Once gold managed to exceed the highs of the day (yesterday) a flood of market if touched (MIT) buy orders were all over the place and the price was quickly marked up.

GCM7 Gold June Comex Intraday (120 min) chart

Gold June Comex intraday chart


There is literally tons of resistance from here all the way to 700$. This is the intraday wave v and once completed a correction will be needed.


GCM7 June COMEX Gold daily chart


COMEX Gold daily chart


To understand my technical work you must have knowledge of Elliott wave theory. You might want to check this online tutorial. For access you only need to be an Elliott wave international club member. If you can afford then order R. Precter book: How to Forecast Gold and Silver Using the Wave Principle.

Wednesday, May 02, 2007

Short Term bottom in place?

Dear readers,

Seems to me like intraday wave 4 is over and wave number 5 is underway which should exceed 698$ for the Comex June contract (GCM7). For the relevant Elliott wave count refer to this post.


A break above the short term downtrend line will give confirmation.

GCM7 Gold June Comex Intraday (120 min) chart

Comex intraday gold chart

Tuesday, May 01, 2007

Short Term Update

Dear readers,

The Europe session will soon begin and the short term momentum haven't turned up yet. So whether we like it or not short term downside still possible. The GC June contract (COMEX GCM7) is trading between the 50% and 61.8% Fibonacci levels. Long silver short gold spread trades haven't been profitable for a while so take note. As always, keep an eye on XAU, HUI and Of course EUR/USD & Crude.


GCM7 June COMEX Gold daily chart


COMEX Gold chart

Thursday, April 26, 2007

Gold Spot & Futures Charts

The USD Index hovers near decades lows, the EUR/USD pair kissed its all time high (~136.667) currently floating less then a cent below. The jury is still out as things can abruptly change on a penny or less…

So far June COMEX gold contract failed to exceed its late February high (~699$) while spot gold managed to trade above the same cyclical high. The contango is taking its toll.

XAUUSD Intraday Chart (4 hours candles). Annotated with Fibonacci levels and Elliott wave count ( wave 4 underway). As posted before; ~667$ spot remains target before heading higher.

XAUUSD Intraday


GCM7 - COMEX Gold June contract daily chart. Annotated with Fibonacci levels and Elliott wave count (wave iii blue underway). Note support at ~672$, just below the 50% Fibonacci line.


COMEX gold


  • As explained before, take any of my posts in the right time frame context.
  • I observe and estimate that the price of gold is constructing an Egg pattern which requires extremely high degree of patience.

Wednesday, April 18, 2007

COMEX GOLD (GCM7)

Dear readers,

Just a quick chart update, this time for the COMEX Gold active contract (GCM7). COMEX is where the big guys like to hang out.

Platinum ETF might be issued in Switzerland

Daily chart - COMEX June Gold 100 OZ Contract (GCM7)
Comex Gold Chart