Sunday, April 30, 2006

USDX E - waves & Gold / Euro update

The Gold Silver ratio (XAU / XAG) = ~ 47.70, Dow / Gold = ~17.38, Gold / Crude Oil = ~9.13.

The U.S. Dollar Index (USDX) – has been around since 1973. USDX is computed using a trade-weighted geometric average of six currencies. The six currencies and their trade weights are: Euro -- 57.6% Japan/yen -- 13.6% UK/pound -- 11.9% Canada dollar -- 9.1% Sweden/krona -- 4.2% Switzerland/franc -- 3.6%. USDX chart is showing a pattern of Head & Shoulders and the target = 81.5, could bounce back into the triangle , 61.8% line = ~85 =important support. I wouldn’t bet on it but the USDX can stay in the ~80 - ~92 trading range for years.

Gold in terms of Euro is showing similar pattern like Gold / USD , not surprising – is it?

click on the charts below to enlarge:

USDX USD index chart


GOLD Euro chart

Saturday, April 29, 2006

Gold price prediction 2006

The gold market is difficult to analyze for the reason that investors, traders, and speculators are buying gold for many different reasons. Inflation hedge, currency hedge, stocks, bonds property market, gold seems a good hedge against all of them. Others see gold as a war, terror play. The long term history of gold, the global market atmosphere and the recent price appreciation are all pushing gold back to the front stage of the global economy. The dust is being cleared as gold is gaining more market attention, the popularity is raising; gold is out of the dark corner.
Speculators are making transactions which result in quick profit or loss plus commissions. Others buy gold with a long term strategy in mind. The supply demand equilibrium is presenting a case of itself.

Technically, the intraday price range have gone as large as 40$ a day. The ascending triangle indicating a short term initial target of ~ 683$ per 1 gold troy ounce, the symmetrical triangle point to 671$ / 1 gold oz . Gold has gained 56% against the USD since the second Elliott wave started (41 weeks ago). The average positive return was 1.37% per week. If I extrapolate this data the new gold price target for 2006 is 939$.


intraday gold price chart

xau gold price chart


See this post Gold Global Perspective: How high will gold go in 2006?

See Elliott wave tutorial

Friday, April 28, 2006

Gold Channel & Silver ETF , SLV

There is probably a lot of highly leverage day trading taking place in the precious metals market. This kind of silver (XAG) and gold (XAU) gambling is taking place in the form of derivatives, CFDs and in house forex speculation. The intraday gold price pattern of yesterday shows a pattern of M or W, this kind of pattern is deadly for over laveraged traders since its clear their stops loss then reverse and run away the other direction. Leveraged gold and silver trading is not recommended to anyone but the most professional, experienced deep pockets traders. Ride the wave safely, don't be greedy – it's that simple.

As for the technical picture, here are two daily gold spot (XAU) charts with exactly the same settings (Channel, EMA, MA & Bollinger Bands). The only difference, the first one is a linear chart while the second one is logarithmic. The linear XAU chart shows that gold is trading above the previous upper diagonal channel trend line. The logarithmic gold chart shows that gold is trading just below the same diagonal line. The reason for this is the fact that as the price of gold is accelerating the difference between measuring the price of gold in terms of percentage vs. nominal is more significance. This makes the use of linear trend lines more complex and EMA might be used to give a better exponential / non linear perspective.

Silver ETF , symbol SLV is issued today (AMEX) and since the Silver ETF IPO is widely expected and the price already corrected it should be a non event.


First U.S. Silver ETF Launches Friday A.M.By: Dorothy Kosich
Posted: '27-APR-06 23:00' GMT © Mineweb 1997-2004

RENO--(Mineweb.com) As the first U.S. Silver ETF is officially launched by Barclays Global Investors Friday morning, Silver Institute President Phil Baker, the Chairman and CEO of Hecla Mining, told Mineweb that he views it as a positive move that will, ultimately, generate more interest in silver equities.

Michael DiRenzo, Executive Director of the Silver Institute, noted that the "this investment vehicle will give a wide range of investors the opportunity to diversify their portfolio to silver."

Christine Hudako of Barclays confirmed to Mineweb Thursday that the silver ETF will launch Friday morning on AMEX under the name iShares Silver Trust, (SLV). Earlier this week, Barclays deposited 1.5 million ounces of silver with the JP Morgan Chase Bank to back its 150,000 ETF shares. Each share is equivalent to 10 ounces of silver. source


Gold spot chart

Gold spot log chart XAU

Platinum long term charts , HUI – Amex Gold Bug Index E – Waves

Thursday, April 27, 2006

XAU , XAG - Chart Update

The U$D price of Gold broke out of the short term triangle pattern and the initial price target is 671$. The price of gold made higher low then higher high - positive sign. Retesting of the triangle is probable, support resistance at appropriate Fibonacci numbers, trend lines, check the 10 day EMA (240 hour EMA).

The price of silver is showing more weakness on the downside which is very rational since silver is a much smaller market and volatile compared to gold. However, single digit silver price is probably long term history and that’s enormous achievement in itself – price perspective.


Interesting gold market news coming from India:


Banks hoard gold on hopes of higher retail sales

TIMES NEWS NETWORK[ THURSDAY, APRIL 27, 2006 02:41:38 AM]

MUMBAI: Banks are building up large positions in gold in anticipation of record sales of gold coins to retail buyers during the Hindu festival of Akshay Tritiya.

Among public sector banks, Corporation Bank has imported 10,000 specially-minted centenary coins of 8 gms, a large number of which it expects to sell next Sunday.

Indian Overseas Bank launched its retail gold scheme lask week to catch the Akshay Tritiya rush. ICICI Bank, which is one of the biggest retailers of gold in India, has decided to keep its branches open on Sunday, when they are normally closed. HDFC Bank is selling 5gm ‘Mudra’ bars at 298 branches across the country, offering discounts to customers.

Sale of gold by banks was recommended as a stepping stone to capital account convertibility by the Reserve Bank of India committee. Banks were allowed to freely import gold and sell them to the general public. source

See this link regarding the gold market of Iran:
http://www.lbma.org.uk/publications/alchemist/alch42_iran.pdf

Click on the charts below to enlarge :


gold spot intraday chart

silver spot intraday chart

Copper HG charts

Wednesday, April 26, 2006

Gold & Silver Spot

Here is a short term (30 minutes) candle sticks chart of gold spot with two sets of Fibonacci lines and partial wave count. Gold is forming a triangle pattern and pattern resolution is soon expected.


CPM Group have published their Silver 2006 year book:
http://www.thebulliondesk.com/content/reports/tbd/temp/CPMPR.pdf


Click on the chart below to enlarge and see suggested short term lines (numbers)
Gold spot intraday chart

Commodity charts : Orange Juice Futures (OJ)
, Live Cattle Futures (LC) , Gold and Silver Stocks

Tuesday, April 25, 2006

Iran daily Gold Prices

Intresting Perspective / Case study :

Mon, Apr 24, 2006

source: http://iran-daily.com/1385/2544/html/focus.htm

Gold Prices

The latest open market (unofficial) rates for major foreign currencies and prices of gold have shown huge increases since the beginning of the new Iranian year (started March 20, 2006).

For instance, the price of the full Bahar-e Azadi (old) gold coin reached 1,830,000 rials, followed by full Bahar-e Azadi (new) at 1,680,000 rials; half Bahar-e Azadi, 810,000 rials; and quarter Bahar-e Azadi 405,000 rials. In addition, gold prices also saw a significant growth, with 0.750 or 18 ct Methqal at 638,250 rials, and 0.750 or 18 ct Gram at 138,500 rials.

According to Donyaye Eqtesad, the above-mentioned figures suggest the old full Bahar-e Azadi gold coin saw some 16 percent increase within a few days in the last week of the current year. In fact, the world prices of gold saw just 1.5 percent increase whereas it was 16 percent for the full Bahar-e Azadi gold coin in Iran. Similarly, the price of gold coin in Iran was just 149,000 rials at the end of last year, but reached 195,000 rials at the beginning of this year, which means that it went up by 31 percent!

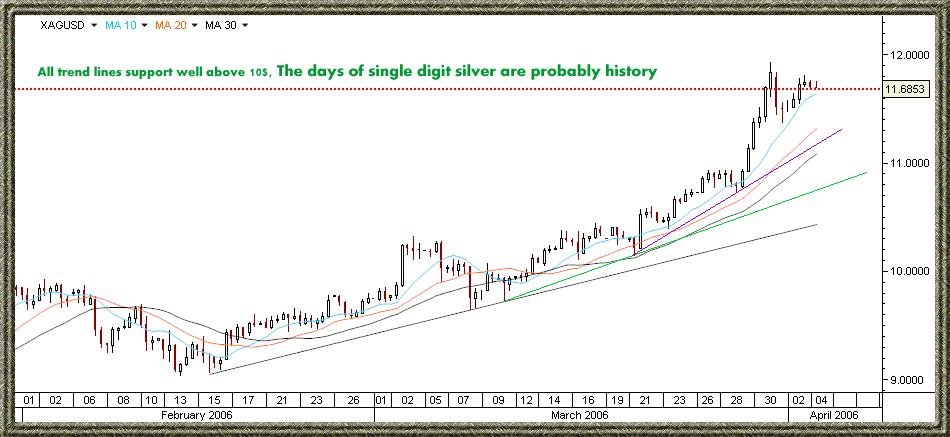
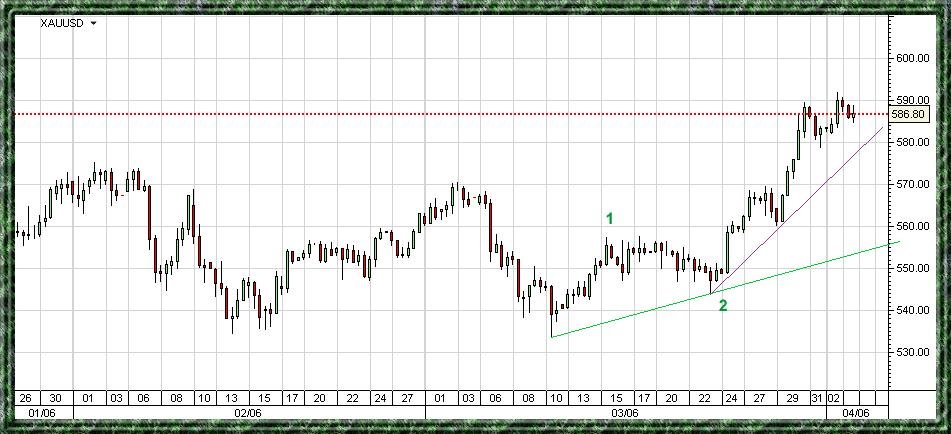
This is amid the fact that the price of one ounce gold was just $554 at the end of last year. It further reveals that the price of one ounce gold also underwent a 10-percent increase.
The huge difference between the prices of gold in Iran and those in the international markets show that although world prices of gold have gone up, they have no bearing on the significant increase in the price of gold in Iran, which has gone up for other reasons in the domestic market.

What can be the possible explanation for such a huge difference and who is behind it?
The first explanation for the sudden jump in gold prices in Iran could be that it follows the fluctuations of gold prices in world markets. The second cause, that is the pressure of demand, plays a far more significant role in creating such a huge difference. But what could have possibly caused such a demand in the Iranian markets?
The increase in the prices of crude oil in the international markets has led to a massive increase in government revenues and its current costs. This has, as a result, led to an increase in the volume of liquidity.

At a time when the housing market remains in recession and not much is going on in the stock market, the safest way to absorb the liquidity is the gold market. The initial increase in the prices of gold in the Iranian market - because of market fluctuations abroad - got the attention of market players. The initial growth encouraged them to buy more gold, and this, as a consequence, pushed up prices even further and far beyond those in the world markets.

The big question is whether such fluctuation in the gold market is in line with the government slogan of social justice for all?
No doubt, the current situation in the gold market does not bode well for the officials, but then again it is the direct result of their policies, which have increased current costs and contributed to liquidity growth.
Government officials should take note that they are not in a position to control all aspects of the market economy. They also need to ensure that their policies for a specific market will not cause trouble for other markets. "


gold spot intraday chart


silver spot intraday chart

Friday, April 21, 2006

Gold and Silver: Wild Price Action !

Expect this wild price behavior to continue, in 20 days the price of gold moved from ~585$ to 645$, then 24 hours correction and the gold price fall 38$ … The silver price is even more volatile pulling back 3$ in 24 hours. This wild action could be destructive for mismanaged over leveraged positions both on the long side and the short side, successful trading opportunities will probably continue to be offered by both silver and gold. This correction will develop one way or another, the market will speak. Accumulation will continue in my opinion – this is a temporary market reaction.


Silver spot intraday chart

Gold spot intraday chart


Related : Commodities Charts , Gold & Silver Stocks

Wednesday, April 19, 2006

Gold , Silver Charts update , Iran CB

Interesting news coming from Iran:

Iran central bank moves to calm gold rush
Khaleej Times, (AFP)
19 April 2006

TEHERAN - Iran’s Central Bank moved on Wednesday to slow down a sharp rise in the price of gold, state television said on Wesdnesday, as traders spoke of increased public demand due to tensions over the Islamic republic’s nuclear programme.

The price of a gold coin weighing around 10 grammes (about a third of an ounce) reached 1.85 million rials (about 202 dollars) late Tuesday, a 25 percent surge on prices two weeks ago.

Following the Central Bank move to supply more coins -- which many Iranian prefer to buy rather than place cash in a bank -- prices fell back to 164 dollars.

“The price increase in is line with the rise in international prices, but there is an additional psychological factor here,” gold coin trader Javad Zargar told AFP.

He said demand spiked following last week’s announcement by hardline President Mahmoud Ahmadinejad that Iran had succesfully eneriched uranium -- despite a UN Security Council call for a freeze of the sensitive nuclear work. -source


spot Gold intraday Chart

spot Silver intraday Chart

XAU & XAG Aiming For New Highs (Charts)

The Gold Silver ratio (XAU / XAG) = ~ 43.67, Dow Jones Gold ratio ( Dow / Gold = ~ 17.61, Gold / Crude Oil ( CLK6 , Crude Oil, Light Sweet, May 2006 ) = ~8.88.
At this stage of the game the long term charts are very important, the short term charts are applied with much more context this way. Gold is accelerating in price, silver is sky rocketing. Investment (in reality mostly savings) capital is flowing into this relatively small financial sector, price multiplication is rational possibility.


Gold long term log chart
long term gold log chart


Silver long term log chart
long term silver log chart


XAU intraday chart.
XAU intraday 1/2 Hour chart.


XAG chart.
XAG intraday 1/2 Hour chart

Tuesday, April 18, 2006

Gold & Silver Open Interest Summery+ XAU & XAG Charts

Here is Gold and Silver open interest Summery table which aggregate the data of the COMEX (NYMEX), CBOT & TOCOM Exchanges.


gold and silver open interest chart


Those are not charts of some hot stocks but charts of natural resources, rare minerals which experienced 20 years bear market , The Third Elliot wave is far from over and can easily exceed the old highs for silver and gold , this markets are relatively small when compared to the other financial markets.


Gol spot candle chart


This is not the gold and silver bull market of the 1970's. The Information technology have changed the way markets works, today's market are almost completely computerized. Markets information is much more available to investors all over the world.


The 1980 highs are getting more and more relevant for gold.

Gold chart 1980


See relevant posts:

Long term Gold and Silver charts

Gold measuring (applicable for silver)

Physical vs paper gold

Monday, April 17, 2006

Gold and Silver Bull Market Summery April 17 - 2006

Relatively strong upward movement for Gold and Silver but still no real excitement , some market observers start to question the 1980 gold price high. The Great Global Gold Bull Market and Silver Bull Market are eccelerating and the signs of Third (years major)Elliot wave are clear. The Gold Silver ratio (XAU / XAG) = ~ 4.58, Dow Jones Gold ratio ( Dow / Gold = ~ 18.00, Gold / Crude Oil = ~8.53.


Gold

spot Gold intrady price chart


Silver

spot Silver intrady price chart


Related Post : The importance of the Dow Jones / Gold, Gold / Oil & Gold / Silver ratio


More Commodity Charts

Gold and Silver Mining Stocks: IAMGOLD Corporation (NYSE:IAG), (TSX:IMG) & (ASX:IGD)

Gold and Silver Mining Stocks: IAMGOLD Corporation (NYSE:IAG), (TSX:IMG) & (ASX:IGD)

Friday, April 14, 2006

Gold vs. X

There are numerous press release, short recommendation, publication and observation which are all stating a bearish view toward the USD. I am well aware of the arguments which imply that the USD should head lower vs. other national currencies and there is no need to mention them. But, as I already discussed in several previous posts, the Forex market seems to be well managed toward stability.

Here is a performance comparison 200 day chart between several popular national currencies, Gold, Silver and OIL. Looking at the chart it is very easy to notice that almost all national currencies are actually down to unchanged against the USD (200 days time frame) the exceptions are the South African Rand (ZAR) and the Canadian Dollar – both are gold, silver & commodity rich nations.

performance gold chart

The conclusion is this: Under current market conditions it is a possibility that the USD will continue to stay relatively unchanged vs. other national currencies. Regardless of the country you are living in, gold and silver savings have been profitable the last 200 days. Investors who look for currency diversification should look at gold (with a glance of silver) and ignore the minor fluctuation in the Forex market.

Thursday, April 13, 2006

Gold spot ( XAU ), market commentary & chart

The observation that the Gold price is rising because of geopolitics or due to the rate of inflation is very common. However, I believe that the price of gold is simply affected by the present physical supply and demand at spot price. Geopolitics & Inflation are factors which affect the demand and supply of physical gold, but they are certainly not the only factors, other factors are: mine supply, central banks transactions, jewelry demand and numerous other potential issues.

In my opinion the physical supply and demand can support higher and possibly much higher price of gold. The geopolitical and Inflation factors could also support much higher gold price under some circumstances. Gold is still somewhat undervalued asset when viewed by some perspectives.

Lately there are lots of bullish market comments regarding commodities and especially gold, contrarian investor might suggest that this is a sign of some kind of top. However, this is the third Elliot wave for gold and public participation is normal at this stage, any pullbacks are supposed to be shallow.

Technically, the price of spot gold is still very strong, a short term trend line is broken and another trend line is established almost immediately.

gold spot , xau intraday chart

Mr. Gary Dorsch www.sirchartsalot.com Published interesting market commentary ( Forex , Gold , Central Banks , commodities and a bit of geopolitics) - link

Exchange Traded Gold funds - ETF ( GLD , GBS , GOLD)

There are currently 4 ETF's which claim that their gold assets are backed by allocated gold held in a vault on behalf of investors. Tottal assets ( as of April 12 2006) = 446.37 Tone (14,350,871 Ounces)

( GLD ) New York Stock Exchange (NYSE) Streettracks, Gold Shares. - link

( GBS ) LSE (London Stock Exchange) AND Euronext Paris Gold Bullion Securities. - link

( GOLD ) Australian Stock Exchange (ASX) Gold Bullion Securities. - link

( GLD ) Johannesburg Securities Exchange (JSE) New Gold Debentures - link

Exchange Traded Gold funds - ETF ( GLD , GBS , GOLD)

( AMEX : DBC ) Deutsche Bank Commodity ETF ( DBLCI )
( AMEX : USO ) United States Oil Fund Lp


GLD , New York Stock Exchange ETF (NYSE) Streettracks, Gold Shares chart

Gold (XAU) short term technical update

GFMS latest observation :Continued Growth in Investment Forecast to Take the Gold

GFMS - A continued surge in gold investment demand has recently pushed the gold price through a series of fresh multi-year highs.In its Gold Survey 2006 ,GFMS forecast that this expansion in investor interest is likely to continue over the next couple of years,driving the price comfortably over the $600 mark before the end of 2006,with the potential for a new all time high in the longer term horizon

Here is a quick summery of gold short positions.

Gold and Silver mining stocks

commodities charts


Here is an intraday 8 hours chart of gold spot with partial Elliot wave count:

 intraday 8 hours chart of gold spot


Gold spot afternoon fix chart 12- 1979 – 4 - 1981

Gold spot afternoon fix chart 1980

Tuesday, April 11, 2006

Gold , XAU and Silver , XAG Technical update

Gold Silver ratio (XAU/XAG) = ~ 47.45, Dow / Gold (INDU/XAU)= ~18.69, Gold / Crude oil (XAU/WTIC) = ~8.60.

Crude Oil Chart here

Julian D.W. Phillips (The Gold Forecaster)has published 3 parts observation under the name : Gold & Oil - 1971 Until the Future.

Quote:

"As it becomes clearer that the $ hegemony is going too far, as record after record U.S. Trade Deficits are published, most nations and wealthy individuals are seeking to diversify away from the $. It is clear that despite any present or future exchange rate management [and the Fed has just prepared itself to interfere on the foreign exchanges of the world] and the reality that oil is priced in the $ the exchange rate value of the $ is suspect and likely to fall, eventually.

But where are do you run to from the $? All the world’s other currencies are dependent on the global monetary system of which the $ is the foundation on which other currencies rely, especially the Euro [despite its design as a reserve currency]. Each currency has its place in the currency world and has an enormous dependency on the $. We even suspect that those controlling the Euro do so in tandem with the $, so as to keep the relationship between the two largest global currencies completely stable [as can be seen in the last year’s performance of the $:Euro]. So diversifying out into another currency would hardly solve the problem, would it? In the face of a fall from power of the $, all currencies would follow, like Pilot fish stick to sharks, down to the depths."

Part 3: The Future of Gold and the Devaluation of the Dollar


Gold , XAU EURO Chart

Gold , XAU USD Chart

Silver , XAG  USD Chart

Friday, April 07, 2006

Gold / $, Gold / € & Gold / ¥ Correlation

I haven't noticed any interesting or important news which are directly related to the gold and silver markets. Just the usual Silver ETF hype, Inflation deflation debates, Commodity bull cycle, Debts and Interest rates & the usual gossip.
Since Jan 01 2006 Gold is up against the Euro (€) ~ 11.50% , up against the USD ($) ~ 13.74% & up Against the Yen(¥) 14.24%
The gold silver ratio (XAU/XAG) = ~ 48.75, Dow / Gold = ~18.91, Gold / Crude oil = ~8.72.

Gold in terms of EURO, USD & YEN is showing pretty good correlation.

Gold in terms of EURO, USD & YEN  chart

2 hours intraday spot silver chart

2 hours intraday spot silver chart

2 hours intraday spot gold chart

2 hours intraday spot gold chart

Gold channel chart

Gold spot channel chart

Thursday, April 06, 2006

Gold and silver intraday charts & short term targets.

The precious metals rally continue. Gold and silver (XAU/USD, XAG/USD) made new multi decades highs today. Technically gold and silver broke out of a short term similar ascending triangle pattern. The gold silver ratio (XAU/XAG) = ~ 49, Dow / Gold = ~18.85, Gold / Crude oil = ~8.77.

For gold and silver mining stocks reviews see: Gold and Silver Mining Stocks blog

gold intraday chart
silver intraday chart

Tuesday, April 04, 2006

The importance of the Dow Jones / Gold, Gold / Oil & Gold / Silver ratios

Dow Jones / Gold, Gold / Oil & Gold / Silver ratios are some of the most Interesting and informative pieces of data, here is why:

When we compare the Price of gold to the price of the two other commodities or the old Dow Jones index the value of the dollar becomes a non issue. It is a simple math exercise, when we look at the price of the Dow , Silver & Oil, we actually look at:

Dow (1 index unit) / USD(1 ? unit ), Silver(1 oz unit) / USD (1 ? unit) & Oil (1 Barrel unit) / USD (1 ? unit).

So if we divide Dow with Gold , Gold with Silver or Oil we can simply ignore the denominator (the USD in this case) according to simple algebra (fraction division law), here is an example :

(A/B)/(C/D) = (A/B)*(D/C) = AD/BC

Likewise:


[Dow (1 index unit) / USD (1 ? unit)] / [Gold(1 oz unit) / USD (1 ? unit)] =

[Dow (1 index unit) / USD (1 ? unit)] * [USD (1 ? unit) / Gold(1 oz unit)] =

[Dow (1 index unit) * USD (1 ? unit)] / [USD (1 ? unit) * Gold(1 oz unit)] =

Dow (1 index unit) / Gold(1 oz unit) =>

This ratio is not directly dependent on the USD (or any other currency)

As you notice each of the objects is measured by a constant measurement unit: Gold and Silver are measured in troy ounce or other weight unit , crude oil is usually measured in barrels or other volume unit, The Dow Jones is measured with index unit. Currencies like the US dollar also pretend to be a basic measure unit , but unlike troy ounce, barrel or any other physical measurement unit currencies are non constant and not stable.

 Dow Jones / Gold ratio chart

crude oil / Gold ratio chart

silver / Gold ratio chart

Gold and Silver update

Gold (XAU) and silver (XAG) are in a very powerful uptrend and higher prices should be expected. I annotated the gold and silver charts with diagonal trend lines support which can be used as stop / enter spots.

see Gold & Silver mining stocks reviews

see Commodity charts

All trend lines support are well above 10$, the days of single digit silver are probably history.
silver (XAG) chart

Gold (XAU) chart

Monday, April 03, 2006

The Islamic Republic of Iran & Gold

Iran denies Swiss paper's claim in withdrawal of Gold assets
Tehran, March 31, IRNA
Iran-Swiss-Gold
An informed source in Central Bank of Iran on Friday denied the news published in a Swiss daily on withdrawal of 250 tons of Iran's gold reserves from that country's Credit Bank.
The Central Bank official, who spoke on condition of anonymity, told the Economy Desk at IRNA Head office in Tehran Desk, "The news published in the Thursday edition of the Bern-based daily Der Bund, on Iran's withdrawal of 250 tons of its gold reserves, worth five billion Swiss francs, and transferring them to Tehran is totally baseless." Der Bund had added in its story that apparently Iran has ever since last October withdrawn 700 tons of its gold reserves, worth sixteen billion Swiss franks, from various Western monetary funds and transferred them to other unknown destinations. Source
According to the CIA World Fact book Iran is holding $40.06 billion (2005 est.) reserves of foreign exchange and gold.


RTS to launch commodity futures trading in May
18:24 | 03/ 04/ 2006

MOSCOW, April 3 (RIA Novosti) - The Russian Trading System (RTS) stock exchange will launch commodity futures trading, including precious metals, agricultural products and petroleum products, in May, the RTS president said Monday.

"We consider futures on gold, agricultural products and metals very promising," Oleg Safonov said.

He told a roundtable that the country's main stock exchange was seeking to allow its clients to trade commodities and that all the necessary related documents had been submitted to the Federal Service for Financial Markets.

Safonov said the RTS would coordinate basic prices with international agencies, that commodity derivatives were a priority, and that the futures market would be developed within an existing segment of FORTS, the RTS derivatives market.

Safonov said the RTS was also planning to launch futures contracts on a short term interest rates by June 1.

"We want to launch this kind of futures contract relatively quickly," he said.

source


What is a fair price for gold ?

Search

SUBSCRIBE

Gold Global Perspective Feed

AddThis Social Bookmark Button AddThis Feed Button

Archive

Labels