Thursday, July 06, 2006

Gold, Silver & Industrial Metals - Charts

Spot gold moved higher to test the 50 daily moving average (DMA) and the 50% Fibonacci line. Gold formed a V bottom that few predicted. The trend line on the spot gold daily chart below implies that gold will make new multi year high no later then mid September. Obviously the 61.8% Fib zone which currently coincide with the 50 daily exponential moving average (EMA or MAE) will offer good support in case of an impending pullback.

gold chart

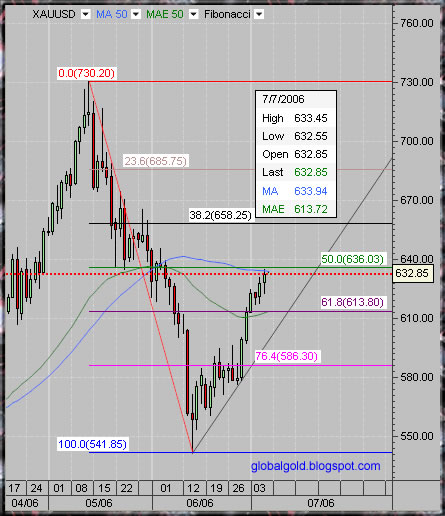
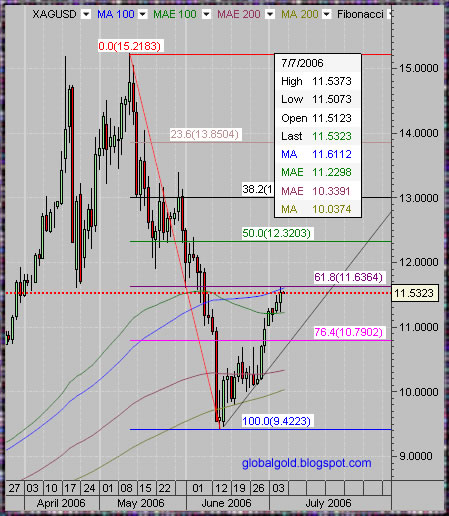
The price of silver is currently lagging gold and the trend line is less steep – however that can change real quickly. Silver moved up to test the 61.8% Fib which coincide with the 100 DMA. The trend line on the spot silver chart implies new multi years high no later then the end of October.

silver chart

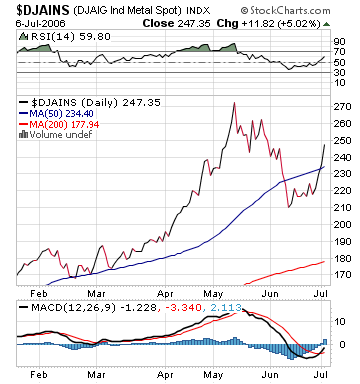
The Dow Jones-AIG Industrial Metals Index (aluminum, copper, zinc and nickel) is up 5% today - outperforming both gold and silver by a wide margin.

Dow Jones-AIG Industrial Metals Index chart

No comments:

Search

SUBSCRIBE

Gold Global Perspective Feed

AddThis Social Bookmark Button AddThis Feed Button

Archive

Labels