


Here is an interesting site that collect eBay gold and silver auction data.
http://www.24hgold.com/english/buy_sell_gold_coins.aspx
Premiums over spot are high to say the least.
Friday, December 05, 2008
Sunday, November 02, 2008
Gold and Silver Charts
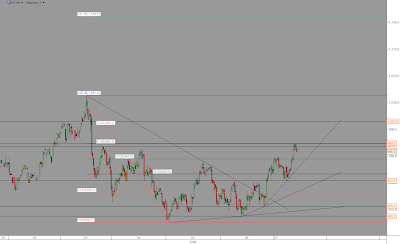
September bottoms failed to hold for both gold and silver. The price of Gold made a new bottom at around 681$ for spot gold. The price of spot silver traded as low as 8.47$.
Gold support and resistance zones: 541$, 559$, 607$, 638$, 681$ <> 744$, 772$, 845$, 930$, 988$,1032$

Silver support and resistance zones: 5.20$, 6.30$, 7.23$, 8.46$<> 11.03$, 12.02$, 12.59$, 13.07$, 13.73$, 16.48$, 19.44$, 21.34$.
Gold support and resistance zones: 541$, 559$, 607$, 638$, 681$ <> 744$, 772$, 845$, 930$, 988$,1032$

Silver support and resistance zones: 5.20$, 6.30$, 7.23$, 8.46$<> 11.03$, 12.02$, 12.59$, 13.07$, 13.73$, 16.48$, 19.44$, 21.34$.

Monday, September 29, 2008
Gold chart update
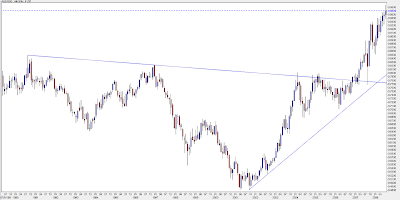
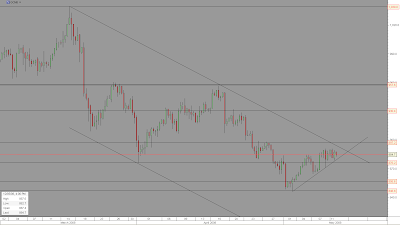
Between March and September[2008] the price of gold declined almost 300$ (1032$ - 736$), So far thats the biggest decline both in nominal and percentage terms – since the global gold bull market had begun. At the same time the price of Silver declined more then 50% (21.34$ - 10.24$).
However, as both gold and silver reached some kind of cyclical bottom a sharp rally then followed:
gold 179$(736$ - 915$) and silver 3.51$(10.24$ - 13.76$).
Currently gold is trading around 877$ and silver 13.20$.
Despite or given the recent extreme volatile price action it is likely that an important cyclical bottom is in for the price of gold and silver.
Gold support and resistance : ~736$, ~831$ <> ~905$, ~988$, ~1032$.

Tuesday, September 02, 2008
GGP Update
Recent downward action is similar to 2006 action , this time the pressure in the markets is probably more severe but there are lots of price action similarities, just do the calculations. Honestly, I do think that gold can go lower in the short to medium term if market pressure continue but over the longer term I do think that much higher rates might be coming.
Thats all for now.

Thats all for now.

Sunday, August 03, 2008
Gold Chart Update (XAUUSD)
Previous week action:
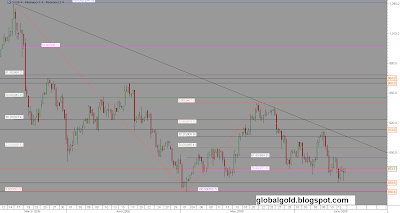
Gold traded between ~893$ and ~934$ which is a 41$ trading range for the week.
Open = 928$ and close 910$, third red candle in a row.
However, gold did not trade below or above any significant low or high.
Cyclical resistance zones: July 15 high of ~988$ and March 17 high (all times high) ~1032.20$.
Cyclical support zones: 12 Jun Low of ~857.45$ May 2 low of ~845.50$.
Pivot zone : ~912$
Currently the most active contract is December gold futures (GCZ8 / ZGZ8 / YGZ8)
Gold spot 8 hours linear chart

Sunday, July 27, 2008
Gold Spot Update
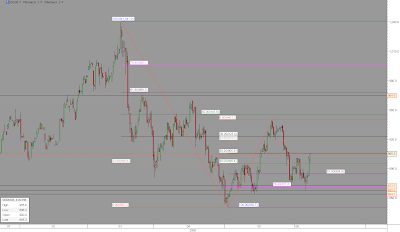
Cyclical resistance zones: July 15 high of ~988$ and March 17 high (all times high) ~1032.20$.
Cyclical support zones: 12 Jun Low of ~857.45$ May 2 low of ~845.50$.
Pivot zone : ~912$
Gold spot 8 hours chart (OHLC)

Cyclical support zones: 12 Jun Low of ~857.45$ May 2 low of ~845.50$.
Pivot zone : ~912$
Gold spot 8 hours chart (OHLC)

Sunday, July 20, 2008
Long term currencies charts
Long term currency perspective , monthly charts:
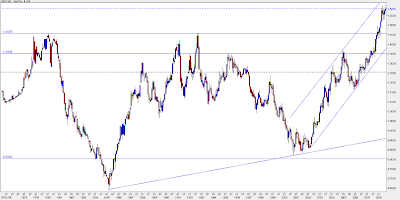
Euro / US Dollar, EUR/USD 32 years chart – partly synthetic
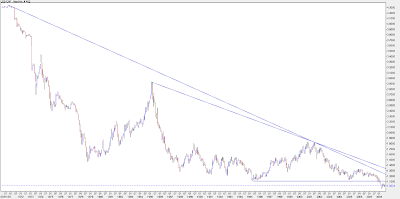
Japanese Yen, USD/JPY 33 years chart

British Pound, GBP/USD 38 years chart

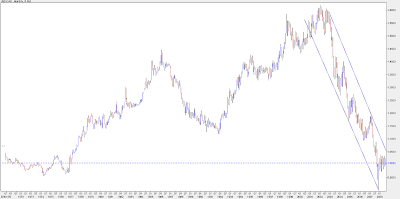
Swiss Franc, USD/CHF 38 years chart
Canadian $, USD/CAD 38 years chart
Australian $, AUD/USD 18 years chart
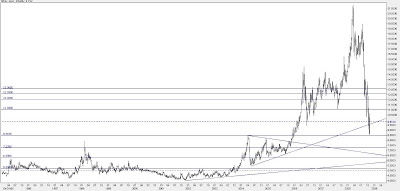
Gold 37 years chart

Euro / US Dollar, EUR/USD 32 years chart – partly synthetic

Japanese Yen, USD/JPY 33 years chart

British Pound, GBP/USD 38 years chart

Swiss Franc, USD/CHF 38 years chart

Canadian $, USD/CAD 38 years chart

Australian $, AUD/USD 18 years chart

Gold 37 years chart

Monday, July 14, 2008
GCQ8 Chart Update
August gold reached 969$.
Support at cyclical lows: 850$ and 860$ are important lows. 875$ and 913$ less important.
No specific resistance point other then the 1041$ high of March, 1000$ and the zone between 969$ to 1002$. If gold can break above the March high (1041$) it can easily move to 1158$ - first target.
GCQ8 Fibonacci Chart – 480 minutes

Sunday, July 06, 2008
Gold Chart Update (GCQ8)
Gold continued higher and August Gold (GCQ8) traded between ~920$ and ~949$ .
Higher lows should probably follow : 850$, 860$, 875$ , ? ...
Resistance at : ~950$ , 960$ - 965$ and then 1041$.
Note the Fibonacci levels and diagonals.
August gold 8 hours chart

Higher lows should probably follow : 850$, 860$, 875$ , ? ...
Resistance at : ~950$ , 960$ - 965$ and then 1041$.
Note the Fibonacci levels and diagonals.
August gold 8 hours chart

Sunday, June 29, 2008
Gold Price Analysis
22 – 27 June 2008 August Gold (COMEX GCQ8 , CBOT ZGQ8 & YGQ8)
August gold future contracts ranged 56$ (~877$ - ~933$). Gold begun the week on the weak side (price did not make a lower low vs. previous week) but finished rather strong.
Support zones for GCQ8 : 875$ , 860$, 850$ and lower.
Resistance zones for GCQ8: 940$, 960$ - 964$ and 1041$.
August gold futures (GCQ8) 8 hours chart

Note: Gold / Crude oil ratio at historic lows

Sunday, June 22, 2008
Gold market summery for 15 – 21 June 2008
It was an inside week – this week the GCQ8 contract traded (~868$ - 912$) within last week range (~ 859$ - 913$) . gold is trading comfortably in recent range with a slight positive bias as the weekly closing price was higher then last week and also the contract closed at the higher part of the trading range.
Equity market are quickly approaching 2008 lows and $indu:gold ratio is probably ready for new lows.
GCQ8 (August Gold) 480 minutes chart

Dow Jones / Gold ratio linear chart

Equity market are quickly approaching 2008 lows and $indu:gold ratio is probably ready for new lows.
GCQ8 (August Gold) 480 minutes chart

Dow Jones / Gold ratio linear chart
Sunday, June 15, 2008
Gold technical update
Dear readers,
This week the August gold contracts (GCQ8, ZGQ8, YGQ8) traded between ~913$ and ~859$ (54$ range). The price did go below 868$ - 864$ but closed the week at ~873$.
For August gold the important low is ~850$ and if that cant hold then there is major support between 835$ and 770$ ( spot gold price). Spot gold 65 weekly moving average currently around 786$.
Resistance zones for GCQ8 : ~895$, ~913$, ~940$, ( 964$ - 968$ ) and 1040$.
GCQ8 480 minutes chart annotated with short term relevant Fibonacci levels.
Spot gold linear weekly chart with Fibonacci levels.

This week the August gold contracts (GCQ8, ZGQ8, YGQ8) traded between ~913$ and ~859$ (54$ range). The price did go below 868$ - 864$ but closed the week at ~873$.
For August gold the important low is ~850$ and if that cant hold then there is major support between 835$ and 770$ ( spot gold price). Spot gold 65 weekly moving average currently around 786$.
Resistance zones for GCQ8 : ~895$, ~913$, ~940$, ( 964$ - 968$ ) and 1040$.
GCQ8 480 minutes chart annotated with short term relevant Fibonacci levels.

Spot gold linear weekly chart with Fibonacci levels.
Sunday, June 08, 2008
August Gold (GCQ8) & Spot Silver (XAGUSD) update
Dear readers,
This last week we have probably seen a successful retest of the low of 864$ and currently gold is trying to move higher towards resistance zone at ~940$.
Support zones for the GCQ8 contract : ~868$, ~864$, ~850$ and Fibonacci levels.
Resistance zones for GCQ8 : ~940$, ~960$, ~964$, ~1040$ and Fibonacci levels.
GCQ8 August gold contract - 8 hours linear Fibonacci chart
Silver has been consolidating and have first support at the 15.96$ – 16.40$ zone and resistance at the 18.33$ – 18.72$ zone. (spot silver prices)
XAG/USD - silver spot daily chart

This last week we have probably seen a successful retest of the low of 864$ and currently gold is trying to move higher towards resistance zone at ~940$.
Support zones for the GCQ8 contract : ~868$, ~864$, ~850$ and Fibonacci levels.
Resistance zones for GCQ8 : ~940$, ~960$, ~964$, ~1040$ and Fibonacci levels.
GCQ8 August gold contract - 8 hours linear Fibonacci chart

Silver has been consolidating and have first support at the 15.96$ – 16.40$ zone and resistance at the 18.33$ – 18.72$ zone. (spot silver prices)
XAG/USD - silver spot daily chart

Sunday, June 01, 2008
August Gold (GCQ8)
Currently the Comex August 100 oz gold future is the most active contract (GCQ8) , open interest for this contract is 257,894 according to NYMEX website.
GCQ7 topped at 03/17/2008 @ 1039.8$ and recently bottomed at 05/02/2008 @850.5$. The trading range this year was ~190$ so far.
Since the 05/02/2008 bottom gold managed to climb ~90$ but then pulled back and lost most of the gain.
Support zones for the GCQ8 contract : ~871$, ~864$, ~850$.
Resistance zones for GCQ8 : ~940$, ~960$, ~964$, ~1040$.
Once this ~190$ trading range is violated refer to the logarithmic weekly gold spot chart below for potential targets and support resistance zones.
GCQ8 August gold contract - 8 hours linear Fibonacci chart

XAU/USD - gold spot weekly log Fibonacci chart

Sunday, May 18, 2008
Gold price short term update
Dear readers,
Gold have managed to break and close above the diagonal trend line resistance. Gold is currently trying to rally higher , there is significant resistance zones all the way up to the top at 1038$ (GCM8) , so new highs are not likely any time soon. What is likely is a prolonged consolidation period similar to the price action that took place between mid 2006 and mid 2007.
The price of gold might have to base around till the 65 weekly moving average will be near.
Short term resistance and support zones as well as Fibonacci levels are outlined on the 8 hours gold futures candle chart below .

The longer term linear weekly bar chart annotated with the 65 moving average ( spot gold 65 MA)

The relevant post Nixon gold "Fix" monthly chart (1971 - 2008)

Monday, May 12, 2008
Gold short term technical update
From mid March to early may the price of the Comex June gold contract (GCM8) pulled back about 190$ (1038$ > 846$) currently trading around 885$ . Along gold recent weakness there is some USD strength vs some of the other popular currencies such as the Euro , Yen , British pound, Swiss frank and others.
The trend is still down ( as defined by the diagonal line connecting the major top (1038$ at mid March) with the secondary top (~956$ at mid April), But there is a minor uptrend inside that bigger down trend channel which give some chance for the 846$ bottom to hold.
Support levels : diagonal minor trend line , ~876$, ~856$, ~846$, ~817$, ~792$
Resistance levels : diagonal downtrend line, ~897$, ~913$, ~930.5$, ~957.5$, ~977$, ~1039$.
June Comex gold futures (GCM8) 8 hours chart

Sunday, April 27, 2008
Gold futures (GCM8) and silver (xagusd) technical update
Gold is down trending and aiming to break support at first April low (876.5$ for GCM8). The price of gold failed to penetrate the 50% Fibonacci resistance at 957.54 and selling pressure pushed the price lower.
Resistance at diagonal upper trend line, ~906.5$ , ~938$ (38.2%Fibonacci) , ~976$ (61.8% Fibonacci) , ~1003$(76.4% Fibonacci) and the high of 1038$.
Support at 876.5$ ,~860, 850$ -840$ , ~820$, 792$, ~750$.
June Comex gold futures (GCM8) 8 hours chart

Gold spot weekly chart

Silver is down trending as well and already lost 5$ from its top at 21.33$ (spot price)
Silver Spot weekly chart

Sunday, April 20, 2008
Short term technical update (GCM8)
The bulls had a few moments of grace as the price of gold managed to trade above the diagonal trend line resistance, but gold failed to penetrate the secondary top at ~960$ and pulled back ~50$.
resistance around ~938$ (38.2% fibo) , ~976$ (61.8% fibo) , ~1003$(76.4% fib) and the high of 1038$.
support at ~888$, 876.5$ 850$ -840$ , ~820$, 792$.
All price relating to Comex gold June contract (GCM8)

resistance around ~938$ (38.2% fibo) , ~976$ (61.8% fibo) , ~1003$(76.4% fib) and the high of 1038$.
support at ~888$, 876.5$ 850$ -840$ , ~820$, 792$.
All price relating to Comex gold June contract (GCM8)

Sunday, April 13, 2008
Gold price short term analysis
Dear readers ,
General observation: In the last several weeks some actions took place, all of them in order to stabilize systematical large size financial risks. Major central banks such as the US Federal Reserve(Fed) and the ECB are keeping a closer eye on the markets, apparently being more flexible and “creative”.
The above has probably a negative continues influence on the affinity to physical gold as an insurance – proof to major systematical financial risks.
Technical condition
Spot chart - gold dropped below the uptrend line which connect the August and December bottoms (2007) but managed to climb back, currently it closed right on that line.

Gold June future contract (GCM8) 8 hours chart - Topped at 1038$ , bottomed at 876$. resistance - so far the 38.2% fib (938$) - , 950$ -960$ (50%) . The downtrend linear channel is still encapsulating the minor uptrend so the bear force has the control on that time frame.

Sunday, March 30, 2008
Gold chart & update
The climate: Continued stress of banks and other financial institutions. In my opinion the source of this stress is illiquidity of non trade able (unlisted at a public exchange) financial “products”.
Outlook: High volatility is present in all markets, extreme events in which investment banks remove huge amounts of liquidity while central banks creates huge amount of liquidity to fill the “holes”.
Technical:
Recent pullback was the biggest since August 2007 bottom, the spot price of gold came down ~128$ (905$) since it's top at 1033$. The spot price of silver dropped from it's top at ~21.35 to ~16.67$.
The trend line which connect the August and November bottoms is still intact. See the chart below for Fibonacci proportions and less steep trend lines. If the recent bottom zone at 905$ - 884$ will not hold then the price might retrace to about 790$ if not lower.
Later on and depending on the fundamental events which will be reflected on the charts – gold might move higher or maybe much higher then recent highs.

Tuesday, February 05, 2008
XAUUSD update
The price of gold advanced about 300$ in the last 6 month. If you multiply that by ~150,000 tons (estimation of total gold above ground - worldwide) then all of that is worth ~ 150,000{tons) x 30,000{average ounces in ton) x 1000(gold futures price estimation) = 4,500,000,000,000$. 4.5 Trillion.
What does it mean? Well… all the gold that people have ever mined is worth about:
100 times more then the capital of the richest man in the world.
10 times more then the market capital of gigantic Exxon Mobil Corp. (XOM)
…
Some significant amount of system risk is priced in, as well as liquidity / inflation expectations.
However, recent bearish trend in many equity markets is suggesting possible downside for gold as well- the liquidity factor.
Perception of system risk should possibly be reduced by needed co-operation of international regulators and primary national institutions.
Technically, Elliott wave pattern suggest a possible completion of sub wave but short term higher high is still possible (less likely). At this stage if a serious correction is underway then a 200$ + correction is not abnormal.
If you participate in the gold market then refer to mid 2006 and note the magnitude of the correction back then. Such scenario can easily occur again.
Gold is much more popular now then 2 years ago, that to me means that from a sentiment point of view gold is either fairly valued or maybe somewhat overvalued. Nevertheless, in coming years it is still possible and also likely that higher highs can be reached.

Sunday, January 20, 2008

Subscribe to:
Posts (Atom)
