Friday, December 29, 2006

Spot Gold Chart Update

Dear readers,

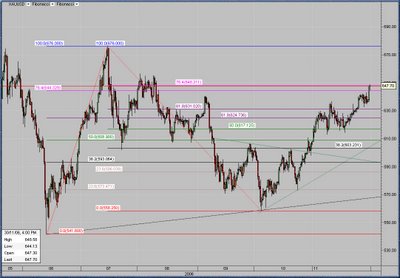
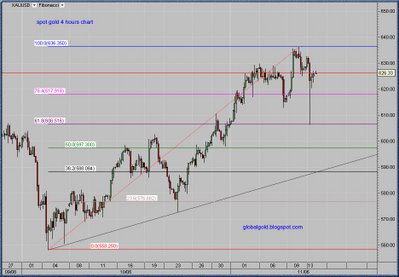
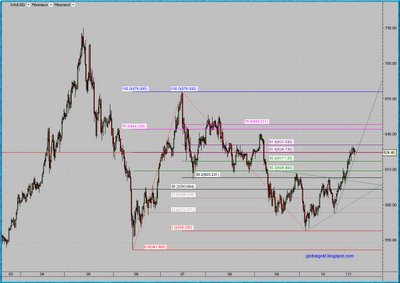
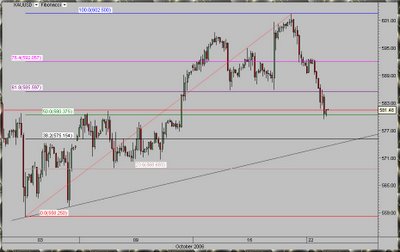
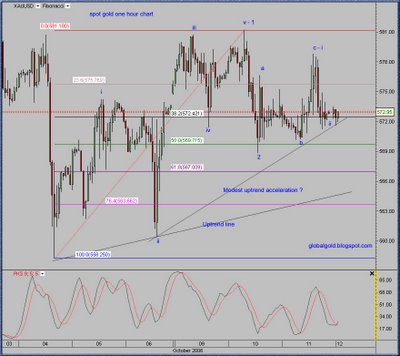
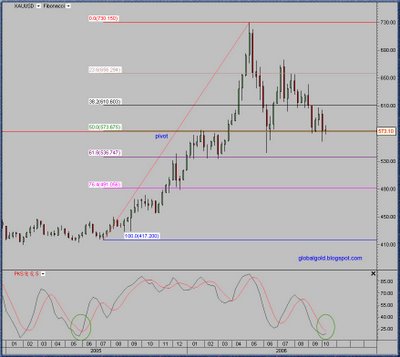
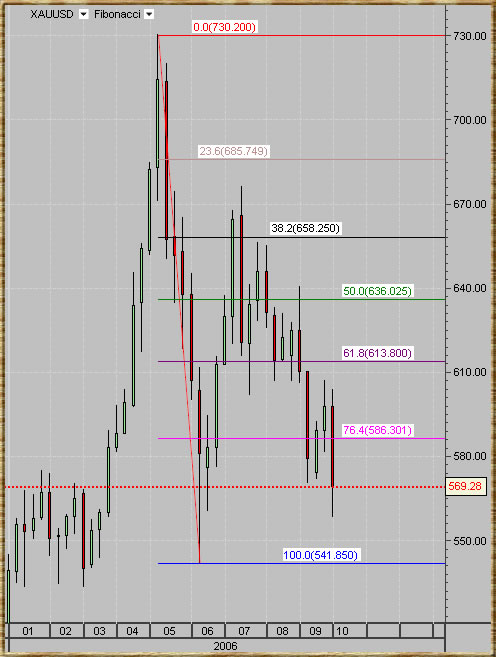
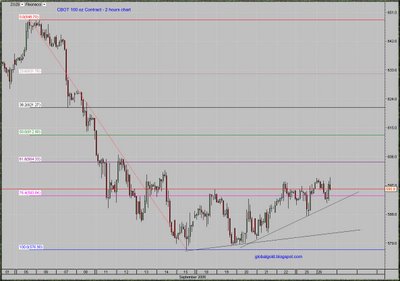
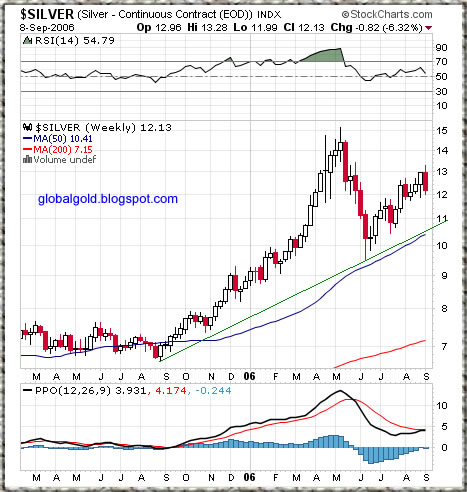
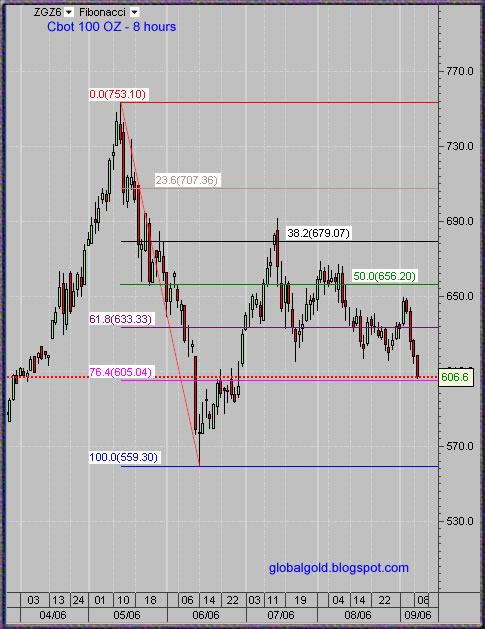
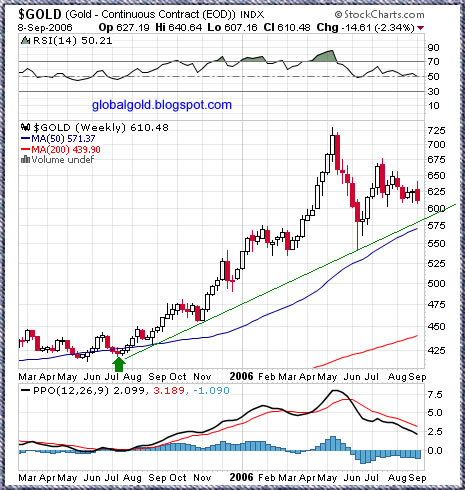
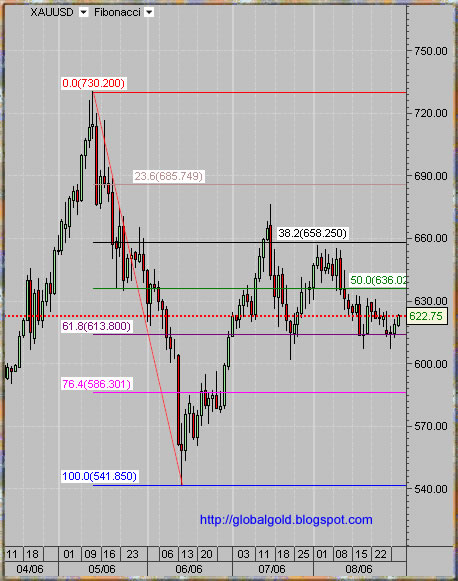
The year is coming to an end and volume is low , meanwhile gold managed to retrace to the 61.8% Fibonacci line of the latest 38$ correction. An up to date intraday chart with Fibonacci lines is posted below.


Monday, December 18, 2006

Gold & Central Banks

It is widely known that central banks hold significant amount of gold and actively participating in the gold market both as buyers and sellers. What is much less known is the exact way in which central banks count their ounces and perform their gold transactions. Neal R Ryan the director of economic research – Blanchard and Company Inc. published an interesting paper about this issue. The paper includes information about gold loans and swaps, Bullion banks - central banks relations, and the IMF opinions about these issues.

See my Previous gold & central banks related posts.

Wednesday, December 13, 2006

Spot Gold – Fibonacci update

Dear readers,

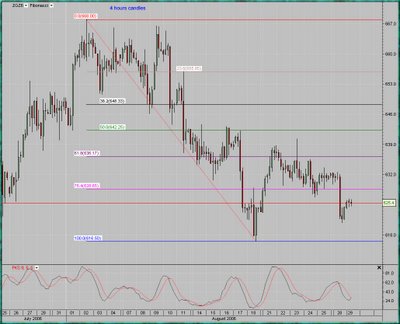
Spot gold 4 hours intraday chart annotated with the latest Fibonacci lines is posted below, click on the chart for larger view.

spot gold intraday chart

Sunday, December 10, 2006

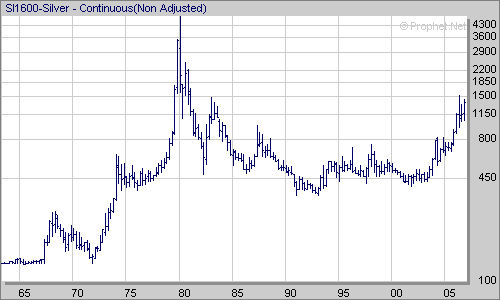
Silver Charts

Dear readers,

I'm posting two charts:

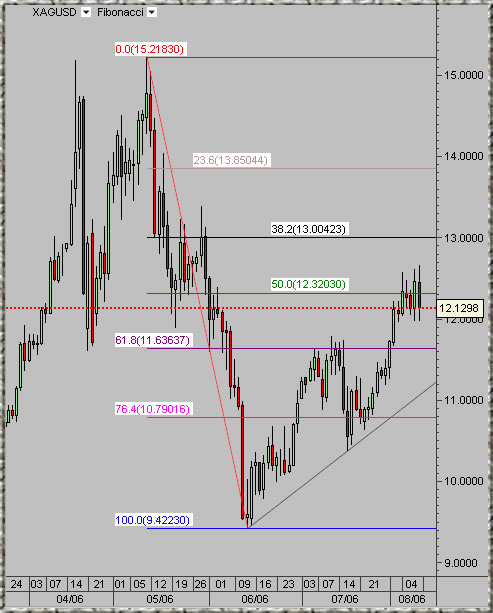
  • Weekly spot silver chart annotated with Fibonacci levels and uptrend line.

  • Long term silver chart.


Previous silver charts and commentary


spot silver weekly chart

long term silver chart

Tuesday, December 05, 2006

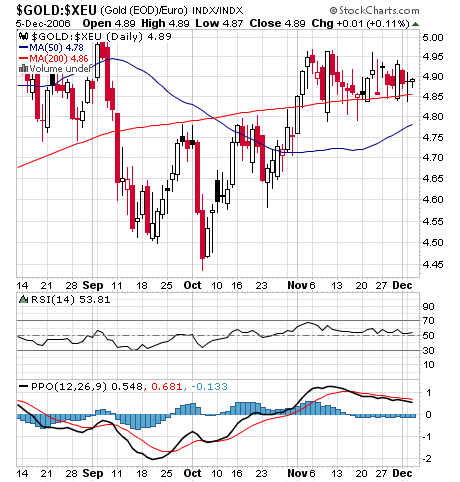
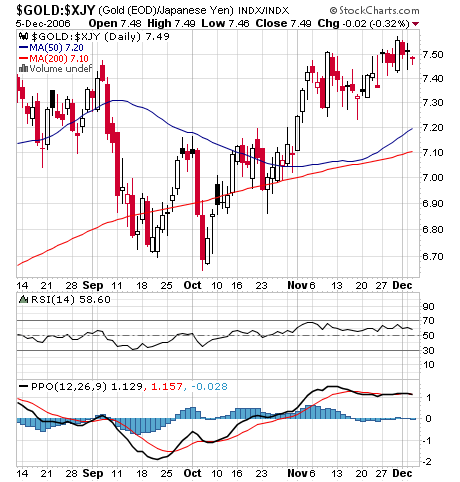
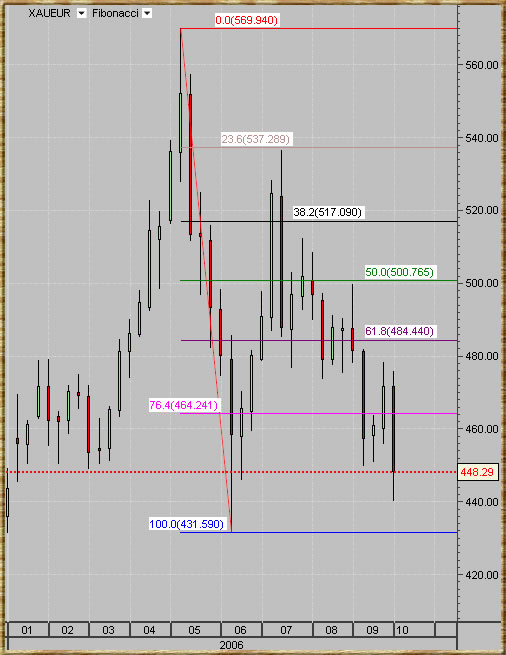
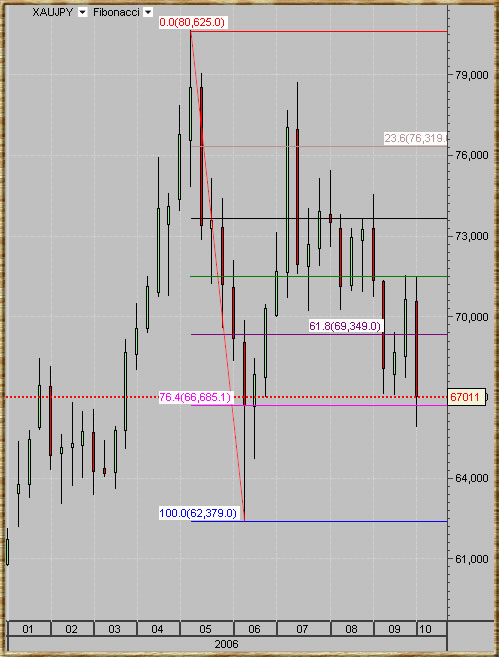
Gold in Euro and Yen

Dear readers,

Don’t be surprised to see Higher USD Index along Higher Gold price.


See also : HUI Breakout

Below are daily charts of Gold in Euro and Gold in Yen, can you see the inverted head and shoulders patterns?


gold euro chart


gold yen chart

Saturday, December 02, 2006

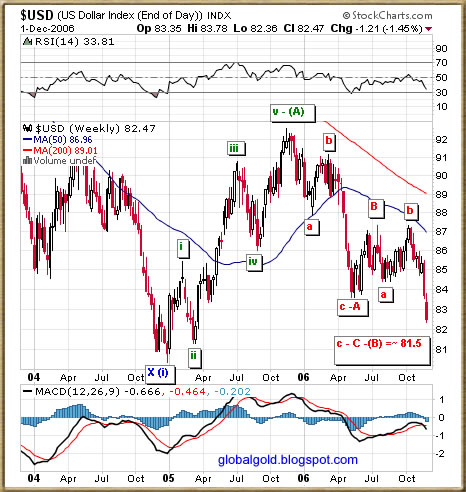
US Dollar Index (USDX) Elliott Wave Update

Dear readers,

The US Dollar Index (USDX) is approaching its Head and Shoulders pattern target (~81.5). The Elliot Waves count on the 3 years weekly chart indicates that once {c – C –(B)} bottom is in place a sustained 5 waves upward move ( Wave C) should start and it will probably last at least one year. Looking at the 20 years chart it is easy to see that the USD index can go a bit higher then 100 and still stay well inside the bear market long term trend. On the bearish side - note the potential gigantic 13 years head and shoulders pattern, the neckline is around 80 and the price target = ~40.


If you are unfamiliar with Elliott Waves, I strongly recommend that you read this short yet excellent EW tutorial.


US Dollar Index (USDX) Elliott  Wave

US Dollar Index (USDX) Long term Elliott  Wave

Thursday, November 30, 2006

Spot gold -commentary

Dear readers,

Spot gold reached the head and shoulders target.

On an Intraday basis I see significant resistance at 648$ , In addition my Elliott wave count Indicate that gold have completed or is very near to complete a 5 upward wave pattern. I conclude that pullback is likely from here but not lower then 590$.

spot gold intraday chart

Wednesday, November 29, 2006

GOLD: Germany , India & Elliott Waves

Dear readers

Please review :


  • Tarapore, former deputy governor, Reserve Bank of India and economist, has strongly advocated for increasing the proportion of gold in the country’s forex reserve.

MUMBAI, NOV 28: Underscoring the benefits of diversifying foreign exchange reserves and the uniqueness of gold component as part of the forex basket , SS Tarapore, former deputy governor, Reserve Bank of India and economist, has strongly advocated for increasing the proportion of gold in the country’s forex reserve. He was speaking at a conference on Foreign Exchange Management: The Way Forward, on Tuesday.

In the past, country’s forex reserves have jumped significantly but the gold holding in it has now dwindled to as low as 3.6%. “If the gold proportion of the RBI’s forex reserves were cautiously raised, to say 10% of total reserves, it would require an additional purchase of gold by the RBI of $10 to 11 billion,” he said. -source

Saturday, November 25, 2006

Gold Market News

COMEX Metal Futures on the CME Globex Platform

New York, N.Y., November 21, 2006 -- The New York Mercantile Exchange, Inc. announced today that it will expand COMEX metals electronic trading to include side by side trading, COMEX miNYs, Asian metals, and London metals futures contracts on the CME Globex® electronic trading platform beginning on December 3 for trade date December 4.

NYMEX will migrate the COMEX gold, silver, copper and aluminum futures contracts, which currently trade after hours on the NYMEX ACCESS® electronic trading system to CME Globex. These contracts will also be offered on CME Globex during open outcry hours, trading virtually 24 hours a day. -source


Related - * CME and C(BOT) to Merge


NCDEX opens futures contracts for gold and silver

TUESDAY, NOVEMBER 21
MUMBAI: National Commodity & Derivatives Exchange Ltd (NCDEX) launched two new precious metal futures contracts on Tuesday aimed at retail investors, an exchange official said.

The new products, a 100-gram gold contract and a five-kg silver contract, join several heavier denomination contracts for the two metals on NCDEX. "This is aimed at retail investors, since every household in India feels the need to invest in precious metals," said, Narendra Gupta, chief of strategy.

Both products would have contracts for every month with the expiry set for the 20th of the delivery month. -source

IMF Should Sell Gold to Cover Looming Losses, Directors Say

By Christopher Swann

Nov. 22 (Bloomberg) -- The International Monetary Fund, the world's third-largest owner of gold, should sell some of its hoard to cover projected operating losses, say a growing number of the fund's executive directors.

The Washington-based lender predicts it will lose $87.5 million next year and $280 million in 2009. Some directors say the fund should sell a portion of its 103 million ounces of gold, valued at $64.7 billion, and invest the proceeds in interest- bearing assets.

``We would support the use of fund gold as part of the solution to IMF financial needs,'' Tuomas Saarenheimo of Finland, chairman of a group that coordinates the position of European Union members on the fund's 24-person board, said in an interview in Washington... -source

Monday, November 13, 2006

Tricks(y) Gold Market

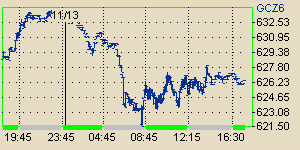
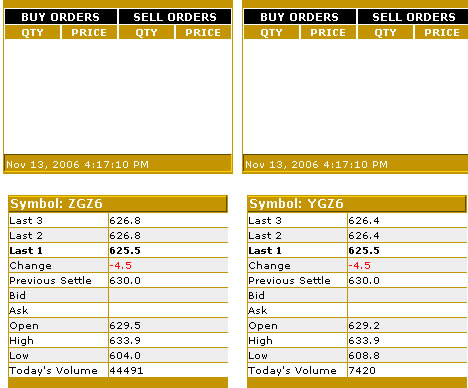
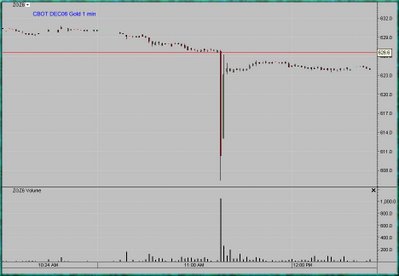
Today at 11:38 (GMT) CBOT Gold Futures Contracts took a deep of about 20$ then fully recovered in less then one minute. About 1100 contracts traded (110,000 Troy ounces) for the ZG contract, According to the CBOT website the mini gold contract (YG) traded as low as 608.8$ while the full size contract (ZG) low was 604.0$.
At the same time NYMEX – COMEX gold contract (GC) was quoted not lower then 621$, The Inter bank and over the counter markets where divided, some followed Cbot while other followed the Comex. All contracts mentioned are December 2006 and spot prices for OTC and Inter bank markets.

Here is what Bloomberg have to report about the issue:


Gold also fell after the sale of the metal in Chicago at a price below the market caused speculators to reduce their holdings.

Gold dropped as much as $26, or 4.1 percent, in electronic trading on the Chicago Board of Trade, to $604 an ounce. The metal in London was trading at the same time at around $625. An estimated 100,000 ounces were sold in Chicago, triggering preset sell orders, said Martyn Whitehead, director of commodity sales at Barclays Capital in London.

``It became a cascade of stop-loss orders, which caused the fairly large $20 gap we saw in the market this morning,'' said Whitehead, who is also vice chairman of the London Bullion Market Association, which runs the gold market in London. ``Someone, somewhere lost a bit of money this morning.''

Prices rebounded before the Comex opening.

``The whole break took about 20 seconds,'' McGhee of Integrated Brokerage said.

Prices May Rebound

Gold may rebound, Perez-Santalla said. ``The gold market didn't drop,'' he said. ``CBOT dropped. Anybody who had stop losses got hurt. It'll remind people of the sensitivities of electronic trading.''

CBOT has captured about 49 percent of the gold-futures market after two years of electronic trading. The exchange last week began open-auction trading on gold and silver contracts to trade side-by- side with its electronic trading platform.

``You have much more of a feel for the market when you're using the floor instead of the screen,'' said Nick Ruggiero, a trader at Eagle Futures Inc. in New York.

Craig Grabiner, a spokesman for CBOT, said he couldn't comment immediately.

-source


Technically it will be logical to assume that gold is retracing some of its 77$ recent move up .

NYMEX-COMEX-intraday gold (GC) chart

CBOT GOLD BOOK

 CBOT GOLD chart

spot gold chart

Thursday, November 09, 2006

Gold Price commentary

Dear readers

Gold and silver have performed well the last several weeks. Gold bottomed at 558$ and is up 77$ since then. Gold and silver have managed to overcome the diagonal downtrend resistance coming from the May top, the event draw lots of attention and market participation is and was high. Please note that I do see signals of short term topping and even in a relatively bullish scenario the 590$ level could get retested. So Long term all is well for this global gold bull market but short term some consolidation might be required.

Monday, November 06, 2006

Spot Gold chart analysis

Dear Readers, Few short notes.

1) October low is higher then June low.

2) Inverted head and shoulders pattern is in place (price objective =~642$)

3) Areas of resistance = 644$ - 648$, 676$, 730$.

4) Today's minor pullback is uptrend constructive in my opinion.

See also Platinum charts analysis, below is 8 hours intraday (24 hours) Spot gold chart.

Spot gold chart

Wednesday, November 01, 2006

Spot Gold (XAUUSD) Intraday chart Update

Below is spot gold 4 hours chart (click on the chart for larger view)

Spot Gold (XAUUSD) Intraday chart

Wednesday, October 25, 2006

Gold and Silver weekly charts

The Intraday (10/24) bullish reversal for gold and silver certainly support the bull case. Below are weekly charts for spot gold and silver annotated with Fibonacci and support resistance diagonals.

Gold weekly chart

Silver weekly chart

Monday, October 23, 2006

Spot Gold Chart - Intraday Fibonacci Update

Dear readers,

I'm posting a spot gold chart with the latest Fibonacci set for your convenience.

For more charts and info browse the archive , see also goldandsilverstocks.blogspot.com and cmd-chart.blogspot.com

Spot Gold Intraday Chart

Friday, October 20, 2006

Gold channel chart

Below is December gold contract (ZGZ6), click to enlarge chart.


December gold  chart

Wednesday, October 11, 2006

Gold bottom?

Gold might be finally bottoming and higher prices are about to follow. Obviously it is not guaranteed and any market participant should make his own decision. I would favor initiating long position at current prices while keeping enough cash for averaging down or up.


The two charts below present the case for what I assume to be important secondary bottom of this great global gold bull market.

gold spot intraday chart

gold spot weekly chart

Tuesday, October 10, 2006

Gold / Euro / Yen

Dear readers,

I'm posting Gold/Euro and Gold/Yen Fibonacci charts for your reference, notice the stochastic crossover.

click on the charts for larger view.

Gold / Euro  daily chart

Gold / Yen  daily chart

Wednesday, October 04, 2006

Gold ($, €, ¥) weekly charts

Some of the latest gold market news from around the world:

Singapore gold fund trading starts next week

SINGAPORE, Oct 5 (Reuters) - StreetTRACKS Gold Shares (GLD.N: Quote, Profile, Research), the world's largest gold exchange-traded fund, would be cross-listed in Singapore next week in a move to capitalise on Asia's growing fondness for bullion.

It will be listed on Oct. 11 on the Singapore Exchange and would be Asia's first gold-based ETF.

StreetTRACK is the World Gold Council's New York Stock Exchange-listed product, with an average daily volume of around $400 million and assets in excess of $7 billion.-source


Official Statistics Confound Rumour of Heavy Central Bank Sales: CBGA Sales in Year 2 Confirmed as Well Under Quota at 393 Tonnes


As forecast in mid-September’s Gold Survey Update 1, sales by the signatories to the Central Bank Gold Agreement (CBGA) ended up far short of their annual 500 tonne quota at just 393 tonnes. This confounds market speculation during much of September that there had been a last minute rush to sell gold before the end of the second Agreement year (on 26th September) and that this was responsible for the period’s price weakness. -source


Riksbank reallocates gold and foreign currency reserves


The Riksbank intends to sell up to 10 tonnes of the gold reserve during the period 27 September 2006 to 26 September 2007. The sale is in compliance with the Central Bank Gold Agreement (CBGA) which was signed by 15 European central banks and came into force on 27 September 2004. The agreement, which runs for five years, enables the Riksbank to sell up to 60 tonnes of gold during this period. To date the Riksbank has sold a total of 25 tonnes of gold, 15 tonnes during the first year of the agreement and 10 tonnes during the second year. The Riksbank’s gold reserve currently amounts to 160 tonnes of gold.-source


CBOT 100 oz Gold Futures Surpass 60% Market Share


CBOT Full-sized Gold Futures Contract Surpass 60 percent Market Share for the First Time in a Single Trading Day
CBOT Full-sized Silver Futures achieves 10,000 contracts in open interest

CHICAGO October 4, 2006 The Chicago Board of Trade (CBOT) announced today that its Full-sized (100 oz.) Gold futures contract surpassed a market share milestone of

60 percent on October 2, capturing 64 percent of all listed Gold futures traded in North America that day. Open interest in the CBOT Full-sized (5,000 oz.) Silver futures grew beyond 10,000 contracts and set a new record of 10,064 contracts yesterday. The previous record was 9,959 contracts set on September 29, 2006.

Average daily volume in the CBOT Gold complex, consisting of Full-sized (100 oz.) Gold futures and options and mini-sized (33 oz.) Gold futures contracts, reached

52,464 contracts during September and achieved a market share of 54 percent of all Gold futures traded in North America for the month. -source


iShares Silver


BARCLAYS Global Investors has applied to register 15.2 million new shares in its iShares Silver Trust on AMEX doubling the total amount that could be invested, Reuters reported.

"We are registering additional shares. That does not mean the trust is automatically going to buy additional metal," Barclays spokeswoman Christine Hudacko told Reuters.-source


Year to date weekly charts of gold in terms of USD, Euro & Yen.


gold euro chart

gold usd chart

gold yen chart

Tuesday, October 03, 2006

Dow/Gold , Gold/Oil Ratios – Update

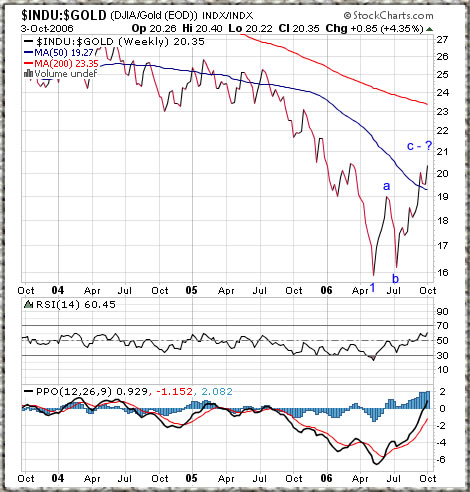
1) The Dow Jones Industrial Average made a new all times closing high of 11,727.

2) Gold is sharply lower. Cbot gold trading had another serious malfunction today (not the first one this year…), AMEX GOLD BUGS INDEX is down 6.67% for the day.

3) The Dow / Gold ratio is nearing completion of an A-B-C correction wave – in my opinion.

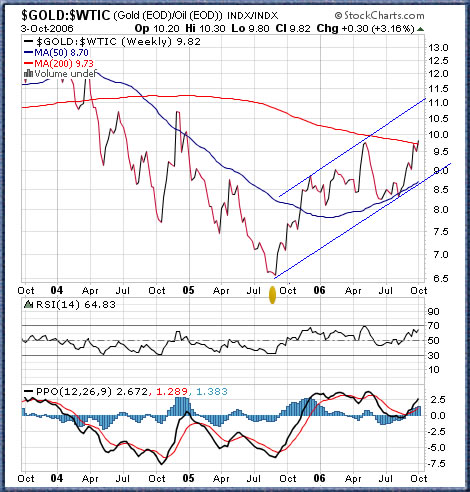
4) The Gold/Oil ratio closed above its 200 weekly moving average for the first time since early 2004.

for more information and charts of gold ratios, See this post : The importance of the Dow Jones / Gold, Gold / Oil & Gold / Silver ratios.


See also HUI/Gold ratio.

Dow/Gold ratio chart

Gold/Oil ratio chart

Friday, September 29, 2006

Silver – daily and weekly charts

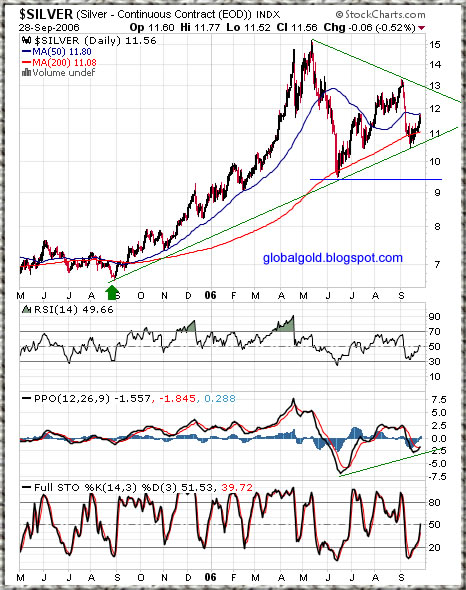
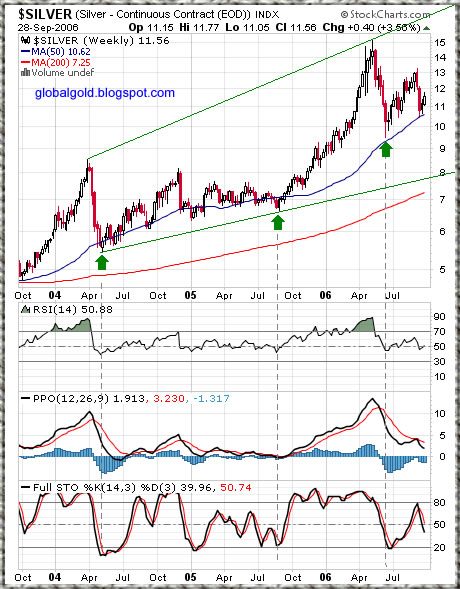
Silver - Poor man gold as some calls it. Silver is one of gold best sentiment indicators. Silver is more volatile then gold, sometimes tend to lead while other times just follow gold. Other then serving as a sentiment indicator for gold, silver is a tradable item by itself.

From a Technical point of view it seems to me that silver (like gold) has just completed an important secondary bottom which is higher then the June bottom. This is good and bullish for both gold and silver. Currently I expect both silver and gold to hold their September bottoms and head higher and retest the diagonal resistance line.

As always, expect and assume the unexpected while trading, at the market place nothing is sure other then fees and commissions.

Silver charts annotated with simple annotations which are self explaining.

Refer to previous posts for more silver charts and Fibonacci levels. As of now no Elliot waves count update.

Silver  daily chart

Silver   weekly chart

Tuesday, September 26, 2006

Gold, Fibonacci Set – Update

If gold will find it way up sooner then later and the 570's USD levels will prove to be an important secondary bottom then the Fibonacci lines on both Spot and Futures gold charts will act as short term support and resistance levels. I'm posting these two charts annotated with diagonal minor uptrend lines.

For GDX, HUI, and XAU – Fibonacci levels, refer to these posts


(You can click on the charts for larger view)

Gold spot intraday fibonacci chart

Gold futures intraday fibonacci chart

Saturday, September 23, 2006

Gold Market News

Central Bank to increase gold metal reserves

RBC, 21.09.2006, Moscow 18:45:08.The Bank of Russia intends to increase the volume of gold metals in Russia's gold and foreign currency reserves, the Bank's First Deputy Chairman Alexei Ulyukayev told the State Duma budget committee today. The share of gold in the country's gold and foreign currency reserves is 3 percent at present. If the volume of gold metals increases, still its share will not raise, he noted.

The prices of gold and other precious metals have been rising lately but the market is correcting at present, Ulyukayev stressed. The gold price is now $550 per ounce, which is $80-90 lower than the record price. The metal prices are highly volatile at the moment, but the Central Bank has not imposed any limits on gold acquisition, he said.

Russia's gold reserves exceed 380 tonnes. -source

Agreement on electronic metals trading

By Kevin Morrison

Nymex Holdings is expected to issue $300m of shares to members of its metals futures division Comex, after an agreement on Thursday for Comex gold, silver and copper futures to trade electronically. -source

Finans Portfoy Launches First GOLD ETF in Turkey

Istanbul GOLD ETF, GOLDIST, will be offered to public on September 21st and 22nd.
Finans Portfoy, an Istanbul based asset management company, launches the first GOLD ETF in Turkey. Istanbul GOLD ETF, GOLDIST, will be listed on the Istanbul Stock Exchange and is expected to start trading next week. GOLDIST will be based on international Gold price and denominated in grams. -source


CBOT Expands Availability of Gold & Silver Options to Open Auction Market


CHICAGO, IL (September 20, 2006) – The Chicago Board of Trade (CBOT) announced today that it plans to expand the availability of its options on Full-sized Gold (100 oz.) and Silver (5,000 oz.) futures by listing the contracts on its open auction trading floor, side-by-side with the e-cbot® electronic trading platform, beginning in the fourth quarter of 2006. Currently, the contracts trade exclusively on e-cbot, the Exchange’s electronic trading platform.

Also, effective October 1, 2006, the CBOT is waiving all Exchange transaction fees for Metals options trading for all fee categories. The fee waiver will apply to Metals options trade transactions on both CBOT platforms. The transaction fee waiver will remain in effect until June 30, 2007. -source


American Stock Exchange Lists Central Gold-Trust

NEW YORK, Sept. 22 /PRNewswire/ -- The American Stock Exchange(R) (Amex(R)) announced today that it has begun trading the units of Central Gold-Trust under the ticker symbol "GTU". The Trust began trading on the Toronto Stock Exchange in 2003 under the ticker symbols "GTU.UN" (denominated in Canadian dollars) and "GTU.U" (denominated in US dollars) and is now dually listed on the Amex. -source

Wednesday, September 20, 2006

Gold spot weekly chart

Look at the weekly chart below then look at the intraday chart at the previous post. Can you see the significance of the 570's for spot gold?

Strong resistance at 610's for spot gold but if gold will start climb back up – (I think it will) almost no resistance from 570's to 610's.

That's all for now.


Gold spot weekly chart

Tuesday, September 19, 2006

XAUUSD - Fibonacci levels

Below is intraday spot gold chart with two sets of Fibonacci lines. Click on the chart to enlarge.

intraday spot gold chart

Saturday, September 16, 2006

Gold & Silver Commentary

The gold and silver charts looks ugly BUT the price of gold and silver is just around the 50 weekly moving average and some horizontal support. Fundamentals still in place. I think that the market is saturated with short side speculation. Long term conservative investors and physical buyers should use the opportunity and increase their regular purchases. See previous posts for relevant Fibonacci levels , take a look at CRB, CCI COMMODITY INDEX and Gold Indices - XAU , HUI - Fibonacci update

Sunday, September 10, 2006

Gold and silver weekly charts

Dear readers, few short notes:

1) Seasonality, depressed sentiment and Euro relative weakness have all brought to an extremely short term oversold condition.

2) The silver chart looks better then the gold chart.

3) In my opinion global geopolitics along global economy developments certainly support higher gold price but not necessarily lower USD index.

4) Long term wave (III) trend lines are annotated on weekly charts, Intraday Cbot active contract is near Fibonacci support level.

 silver weekly chart

gold weekly chart

gold intraday chart

Thursday, August 31, 2006

Spot Gold daily chart

Gold broke down from a triangle pattern but the downside has been pretty poor – the bear trap scenario might be in play (browse the archive for more details). Bear side speculators must be disappointed and might soon suffer great loses.

Spot Gold daily chart

Tuesday, August 29, 2006

Gold (ZGZ6) short term intraday chart

Possible construction of slightly higher gold low. ZGZ6 Contract (CBOT December gold futures) - Fibonacci, intraday chart below (enlarge chart for better view).

Reform on the cards for the IMF

Belgium or India? Which has more clout when it comes to decision making on loans to developing countries and on global economic stability?

Despite India's economy being about twice the size of Belgium's and it having a population of over one billion compared to Belgium's ten million, the European country wields more influence at the International Monetary Fund (IMF).

This is why many think the IMF is ripe for reform - including the IMF itself -source

XAU index Fibonacci chart


intraday gold futures chart

Tuesday, August 22, 2006

Spot Gold Intraday Chart

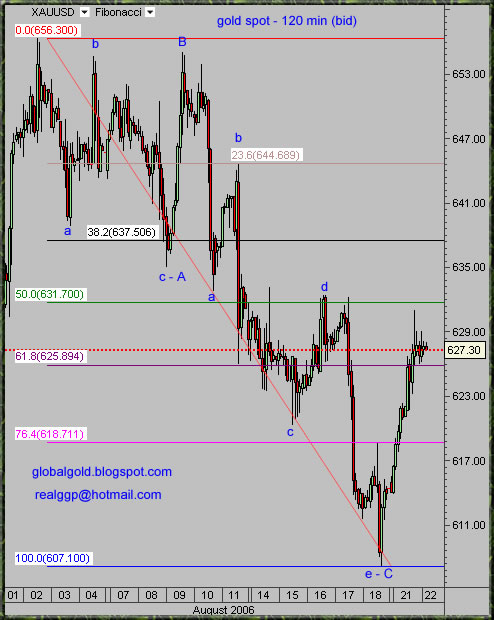
Gold found some kind of bottom at 607$ and currently trading about 20$ higher. Below is spot gold bid price 120 minutes candles chart. August was not a good month for gold but there is still some time for repairs. The chart is annotated with new short term Fibonacci numbers and minor Elliott wave count for your convenience.

For the watch list - VGZ , MNG - charts

Spot Gold Intraday Chart

Monday, August 21, 2006

Gold Market Overview

Gold supply demand analysis papers

Two reports, the first is by the World Gold Council (WGC) and GFMS, published each quarter.

Gold supply demand analysis report I

The second report, the Yellow Book by Virtual metals / Fortis bank, published twice a year.

Gold supply demand analysis report II

The reports are worth reading and basically present the same information. However, each rely on different data and the numbers are not quite the same. In my opinion the data is not so accurate to say the least. It is impossible to track the complete supply demand of gold, some kind of gold transactions are taking place in each and every country and some markets are not very transparent.

Read this reports with a grain of salt , this is as good as it gets but take in to account that all analysts and entities have their own agenda , market sentiment , position and so forth.


Gold miners hedging

The Hedge Book by Mitsui Global Precious Metals, Virtual Metals and Haliburton Mineral Services – This report analyze the hedging practice (forward gold transactions) of the gold miners industry - I assume that this report is relatively accurate when compared with the supply demand reports. This report is tracking the gold mining industry and most of the hedge practice is concentrated with few big miners.

Gold miners hedging report


Gold over the counter derivatives report by the Bank for International Settlements (BIS)

The Semiannual Over-The-Counter (OTC) Derivatives Markets Statistics is comprehensive and provide some information on the size and structure of derivatives markets in the G10 countries and Switzerland. Gold OTC Derivatives are just a small fraction of total OTC derivatives, gold derivatives represents less then 1% of total Over-The-Counter derivatives contracts. Even tough, the numbers related to gold are running at hundreds of billions USD for notional amounts and tens of billions USD for gross market values.

This report is the least mentioned by gold commentators but it is the most important of all in my opinion, the reason? - The sums of money involved in the OTC gold derivatives market dwarfs both total supply demand annual volume and the full impact of gold hedging.

The OTC derivatives report is insightful for the reason it reveals the extremely large size of gold obligations, the numbers are so big that you can be assured that the gold bull market will last many years.

Gold over the counter derivatives report by BIS


CHEUVREUX Gold Report

This report by investment analyst Paul Mylchreest is not less then ground breaking. The report which was published early this year, carry the sub title - "Start Hoarding" and clearly present the bullish case for gold. – Well worth reading.

CHEUVREUX Gold Report


Entities mentioned


The Bank for International Settlements (BIS) is an international organization which fosters international monetary and financial cooperation and serves as a bank for central banks.

The World Gold Council (WGC), a commercially-driven marketing organization, is funded by the world’s leading gold mining companies.

GFMS is a precious metals consultancy, specializing in research of the global gold, silver, platinum and palladium markets.

Virtual Metals is a group of analysts specializing in precious and base metals, energy and soft commodities.

Mitsui Global Precious Metals is part of the Mitsui group and conducts its business in the precious metal market; it is also Japan's largest manager of commodity funds.

Fortis is an international provider of banking and insurance services to personal, business and institutional customers.

Haliburton Mineral Services Inc. is a private mining research and advisory business based in Toronto, Canada.


CHEUVREUX - equity broking and investment firm, subsidiary of Calyon and a member of the Crédit Agricole SA group.
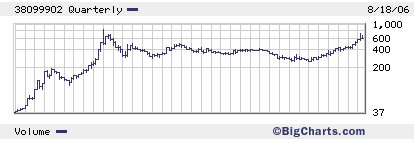
 35 years price history of gold - log chart

Wednesday, August 16, 2006

Gold and Silver Mining Stocks

Dear readers, I'm deeply sorry for posting less lately.
I decided to trade more and post less.

See the latest HUI technical overview.

I will do my best to keep you up to date with any major gold technical and fundamentals developments.

Monday, August 14, 2006

Intraday Gold Charts

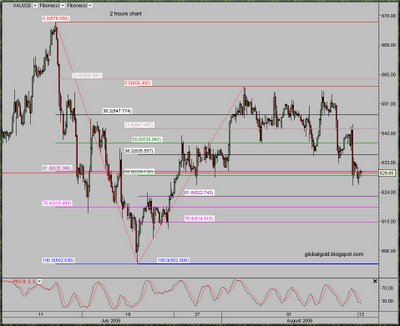
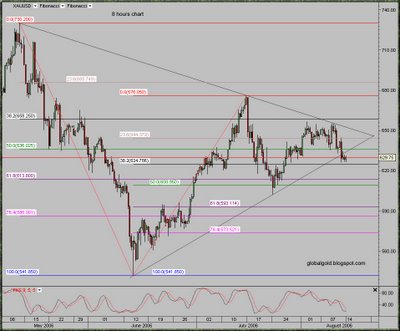
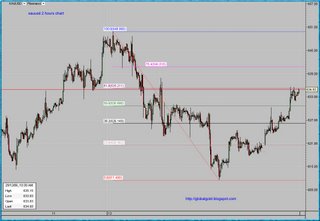
Below are two intraday charts of spot gold, each with two sets of Fibonacci lines and stochastic indicator. Gold broke down from the triangle formation, it's a head fake in my opinion and I did mentioned this possibility here.

Click on the charts below to enlarge

2 hours Intraday Gold Chart

8 hours Intraday Gold Chart

Thursday, August 10, 2006

Gold and Silver Technical Update

GOLD TRUST (GLD) BEGINS TRADING ON MEXICO’S BMV-source

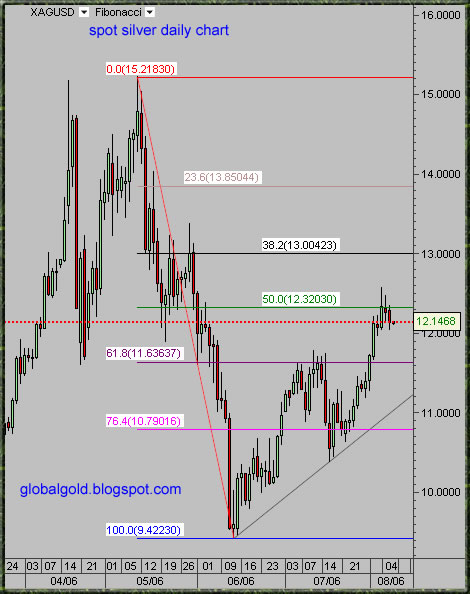
Silver consolidates around the 50% Fibonacci line. Support at 11.63$, trend line support at 11.20$ and raising, resistance at 13$.


spot silver chart , xauusd


Gold had a technical failure of minor proportion, the (C - 2) low on yesterday chart failed to hold. Yesterday wave count is modified to reflect the technical failure. There is nothing to worry about for investors but highly leveraged traders took a hit. The
Inverted head and shoulders pattern with price target of 677$ that I mentioned here is still in play - I believe, coincidently today low was the pattern neckline. Overall the downside for gold is limited while the upside potential is high.

Click on the chart below for enlarged view:

spot gold intraday chart , xauusd

Fibonacci and Parabolic Moves

Just a quick reminder:

1) The price target for gold remains ~1000$ for 2006.

2) Gold will rally regardless of the minor fluctuations in paper Forex markets.

3) The best way to play gold is gold.

4) The price of gold will be determined by gold market internal factors.

long term gold chart

Wednesday, August 09, 2006

Gold Elliott Wave Count - Update

The count on the chart below is inline with previous counts. This is the minor count for Major Wave (iii - III). Elliott Wave is important technical tool which can help and improve your market timing. If you are new to Elliott Waves – see this Elliott Wave Tutorial by EWI (needs registration).

spot gold chart, xauusd

Tuesday, August 08, 2006

Gold and Silver –Charts & Commentary

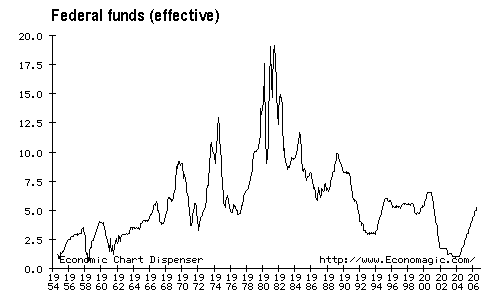
The US Federal Reserve decided to leave Interest Rate Unchanged at 5.25 Percent, Its First Pause in 2 Years.

Federal Reserve Interest Rate chart


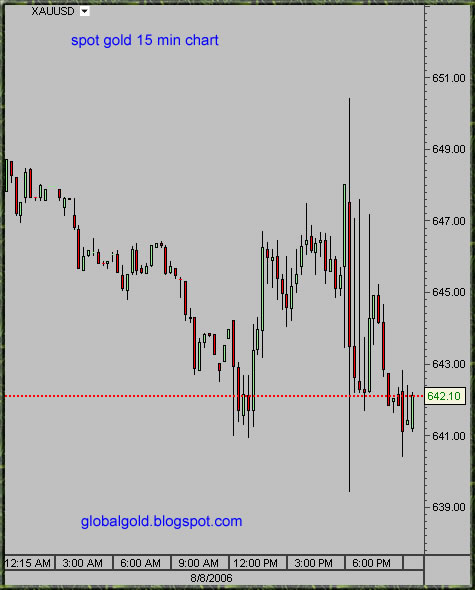
The gold market reacted with modest rally, somewhat abnormally but certainly not surprising - gold immediately sold off and traded at the low for the day.

spot gold intraday chart

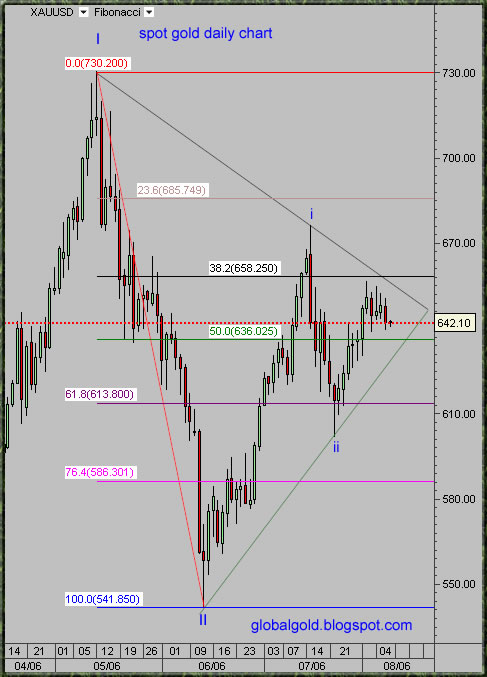
Looking at the daily chart, Same Elliott wave count, this is wave (iii of III), triangle formation which will break to the upside in my opinion and result in a spectacular rally. Notice that gold can go to 630$ and the formation will still stay valid, It is also possible that gold will first break down (head fake). Silver will follow gold and can sometimes lead.

spot gold chart

spot silver chart

All in all a little bit more consolidation is possible but gold will head higher quite soon. Those of you who do not trade gold on an intraday basis can safely accumulate at current price and average up or down.


During Bull markets, for conservative positions - perfect timing is not as important as consistency and patience . On the other hand – for aggressive long positions and short positions of all kinds – Timing is everything!


Q2 2006 Gold Hedge Book Report
This 30 page report by: Mitsui Global Precious Metals, Haliburton Mineral Services, and Virtual Metals Research & Consulting. – Unique in depth analysis of the gold miners hedge positions. - Link

Search

SUBSCRIBE

Gold Global Perspective Feed

AddThis Social Bookmark Button AddThis Feed Button

Archive

Labels