


Sunday, July 30, 2006
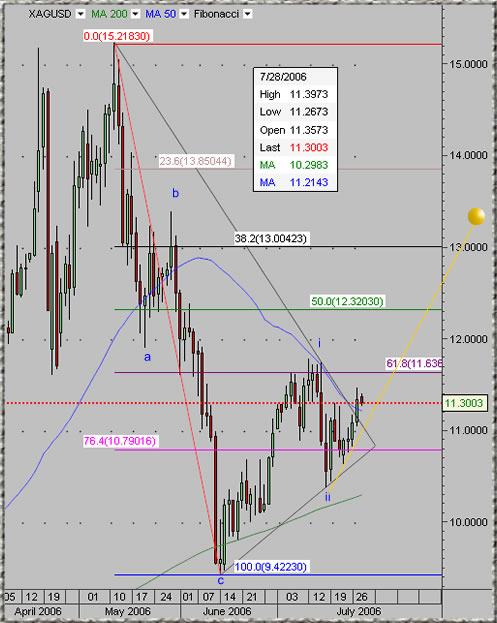
Spot Silver Daily Chart
Like gold, silver recently had serious a-b-c correction wave (15.21$ - 9.42$). Silver bottomed below its 200 DMA, rallied to the 50 DMA (wave i) then pulled back slightly (wave ii).Recently silver succeeded to close above the downward diagonal line connecting the May top and the wave (i) top. Currently the price of silver is above the 50 DMA. In my opinion- silver along gold is headed much higher with good chance for accelerated rally coming quite soon.
Saturday, July 29, 2006
Off Topic - Who visit this Blog ?
Some statistical information regarding this blog visitors.
Data since December 20 , 2005 :
1) 92,119 Visits for a total 230,469 page views. About 55% of visits are returning visitors and 45% new visitors.
2) Geographic location: 55% of visitors from the United States the rest are coming from 99 other countries. Other then the USA most visitors are coming from: Canada, United Kingdom, Singapore, Australia, Hong Kong, Germany, Thailand, Israel, India and Italy.
3) Among visitors are hedge fund managers, speculators, physical buyers, international banks employees and academics.
4) Technical details:
Operating System: 95% using the windows platform, 4% using Macintosh, 1% UNIX systems.
Browsers: 71% are using Internet Explorer, 23% using FireFox , 6% other browsers.
Screen Resolutions: 50% - 1024x768, 16% - 1280x1024, 13% - 800x600 and the rest – 21% are mostly using various higher resolutions.
Friday, July 28, 2006
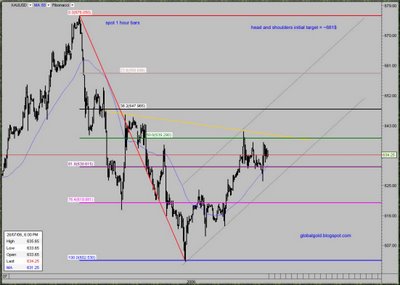
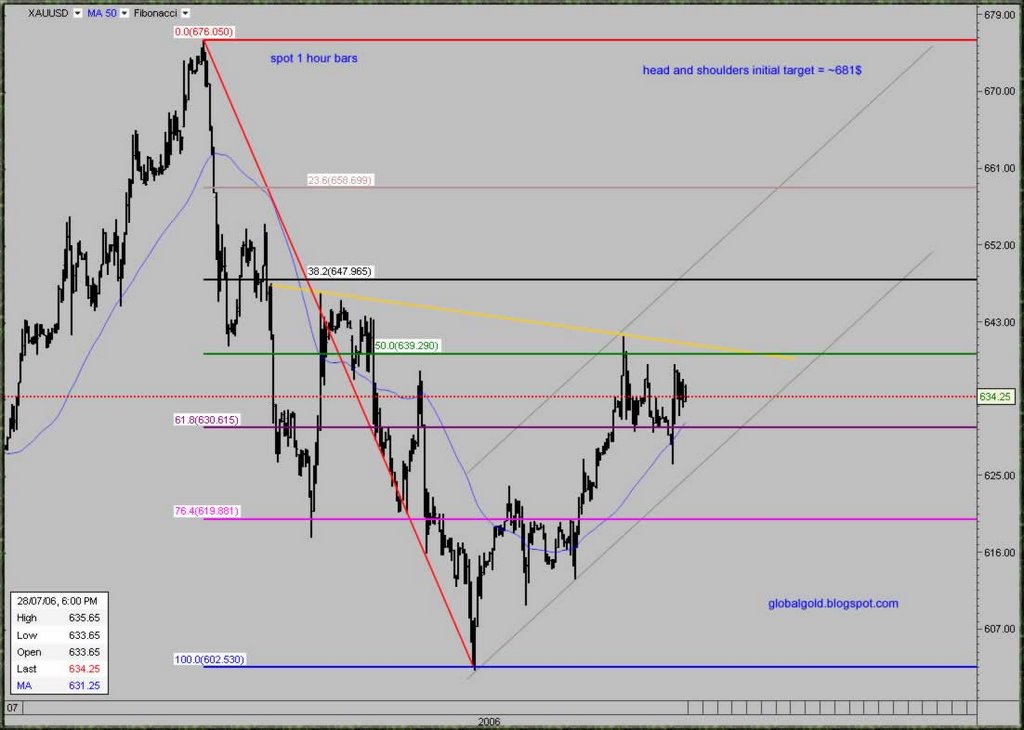
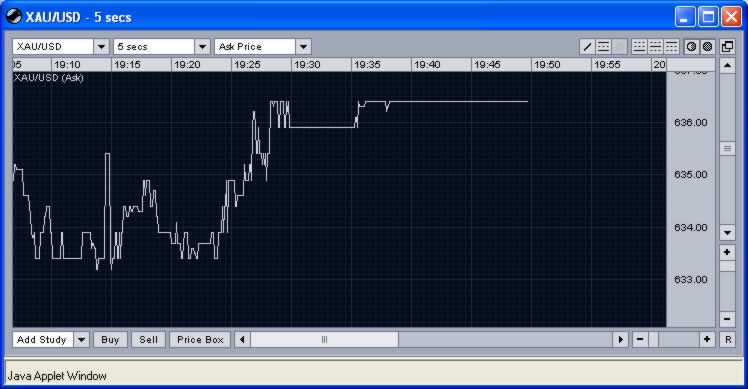
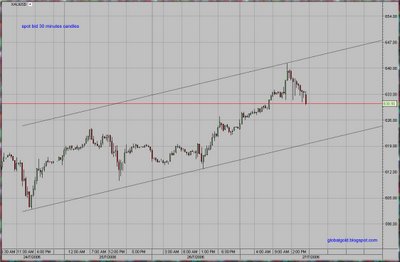
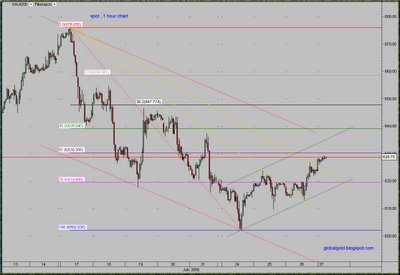
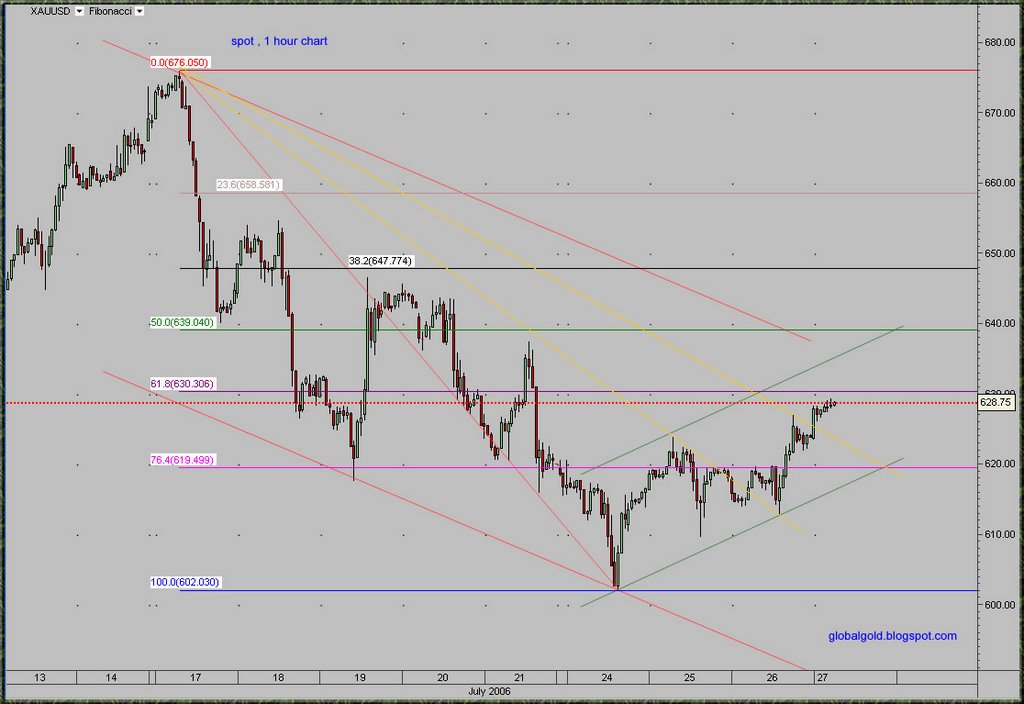
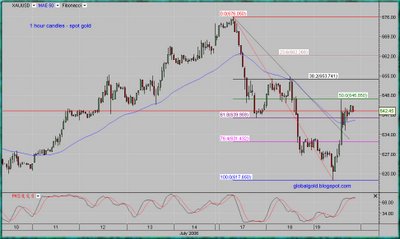
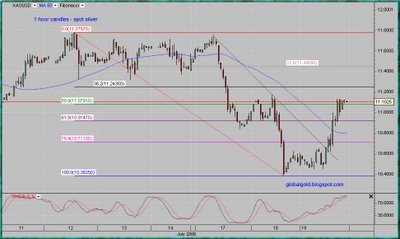
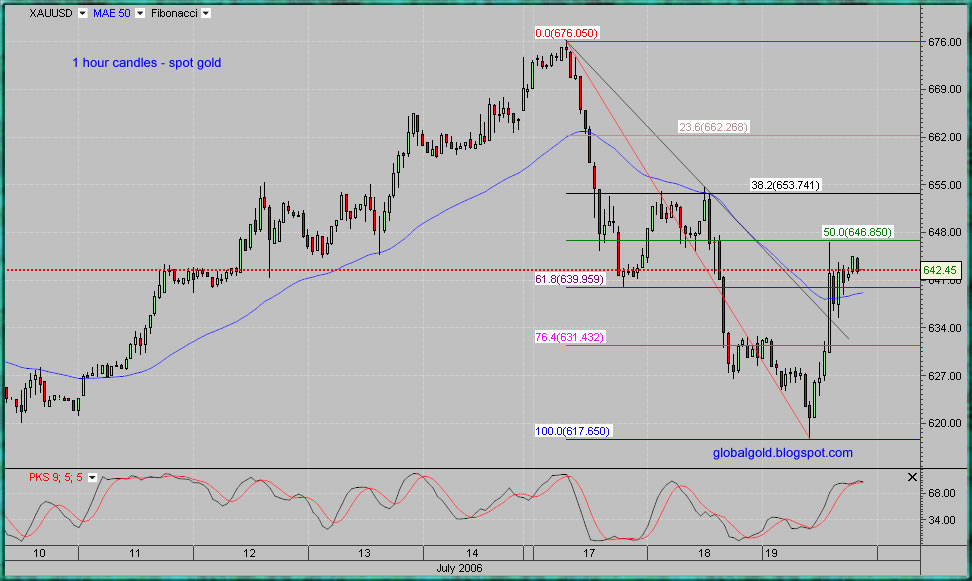
Spot Gold Chart
It was a good week for gold despite the futures market rollover shenanigans. Spot gold traded between 603$ and 641$. The price of gold is quick to recover the recent slump, in my opinion value buyers are quietly accumulating. I didn't notice any important news regarding gold and the price behavior is technically normal.
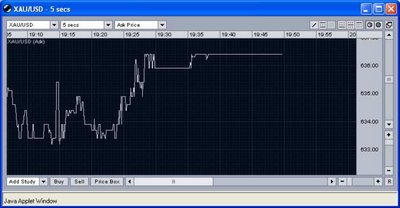
Just before the close of the COMEX trading I noticed an unusual temporary up tick on the spot market – about 2.2$. See the 5 seconds chart below..
If you look closely on the intraday 1 hour chart you can observe potential inverted head and shoulders pattern with initial price target of 681$. Click on the charts below for larger view.
I will post more charts over the weekend.
Thursday, July 27, 2006
Intraday Gold Chart Update
Gold surprised me on the upside today, climbing more then expected. But currently the price of gold is back inside the range I indicated (633$ - 618$). Don’t read me wrong, I fully expect gold to move much higher then 633$ and quite soon.
Russia's gold and currency reserves up $7.2 bln in week
MOSCOW, July 27 (RIA Novosti) - Russia's gold and foreign currency reserves grew by $7.2 billion to $262.9 billion as of July 21 from $255.7 billion a week earlier, the Bank of Russia said Thursday. -source
Below is an intraday spot gold channel chart, hopefully this one holds for more then 2 hours. If this channel holds, gold will trade between 620$ to 647$ during the next 24 hours. Click on the chart for enlarged view.

Gold Intraday Chart - Update
The channel on yesterday chart didn’t hold but gold managed to climb higher after an initial deep. It seems to be the norm for now, If you trade gold on a short term basis you might want to wait till the NY – COMEX exchange do their thing.
Who said gold don’t yield?
Chinese banks step into gold leasing business
Recently, Heraeus Zhaoyuan Precious Metal Materials Co., Ltd. and the Zhaoyuan Branch of China Construction Bank signed an agreement on a gold lease deal of one ton with the lease term of one year.... read more.
Here is a new chart with two channels, the uptrend channel is less steep. Today expected trading range 618$ - 633$.
Click chart to enlarge:
Tuesday, July 25, 2006
30 minute Spot Gold Chart
1) Gold retraced about 61.8% of yesterday move.
2) The Price of gold formed "V" shape bottom again.
3) Today low is higher then yesterday low.
4) If gold will be trading inside the uptrend channel in the next 24 hours , then by this time tomorrow it will be between 620$ and 637$ .

2) The Price of gold formed "V" shape bottom again.
3) Today low is higher then yesterday low.
4) If gold will be trading inside the uptrend channel in the next 24 hours , then by this time tomorrow it will be between 620$ and 637$ .
Monday, July 24, 2006
Gold Market update
This is it ! , My technical work is indicating that the price of gold probably bottomed today. As said before, wave (3) – III - Is about to begin! Exciting times ahead as gold is going to show spectacular strength. The gold market will soon experience a strong, sustained and extended rally. The May top is going to be challenged with good possibility that gold will finely make new all time highs.
Gold bulls should be prudently greedy if I might say. Gold Bears are going to be forced out of their positions in a violent manner.
Gold/$, Gold/€ & Gold/¥ all formed an intraday V shape bottom.
CBOT 100 oz. Gold Sets New Volume Record Today.
Initial price target 777$.
I will update as time permits.
Sunday, July 23, 2006
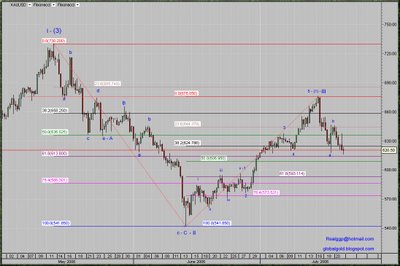
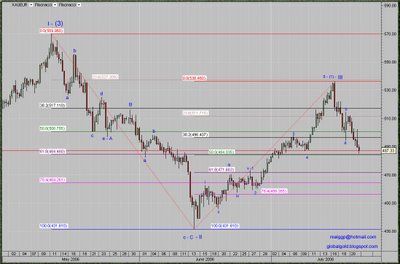
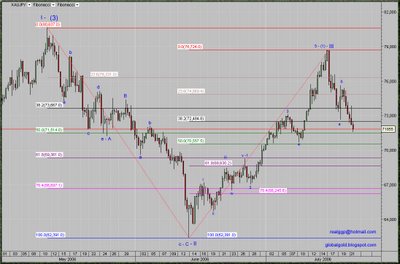
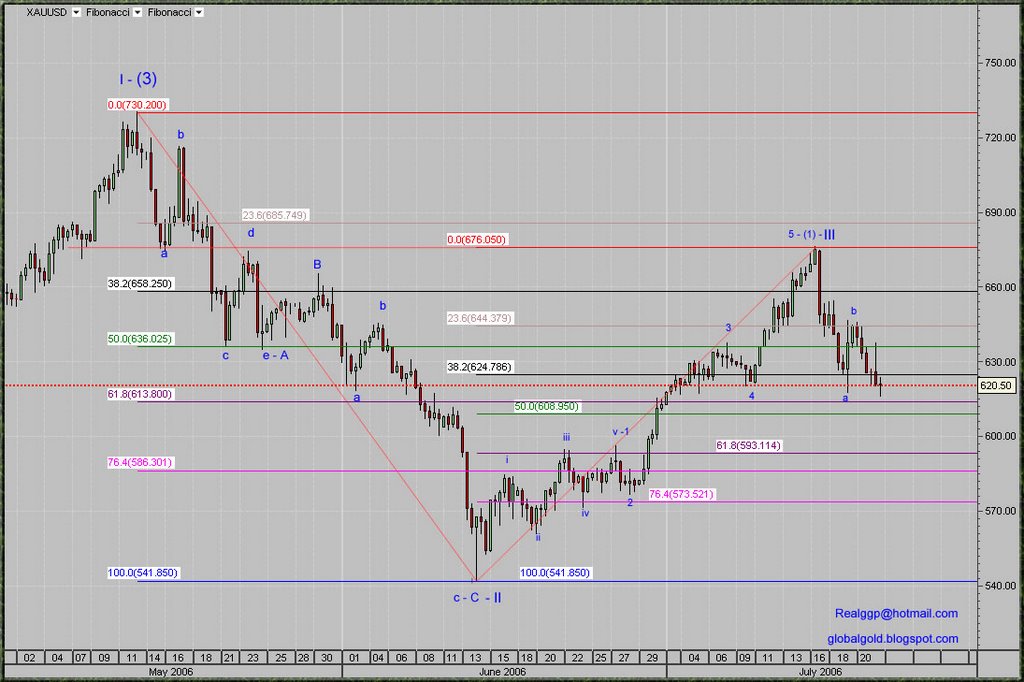
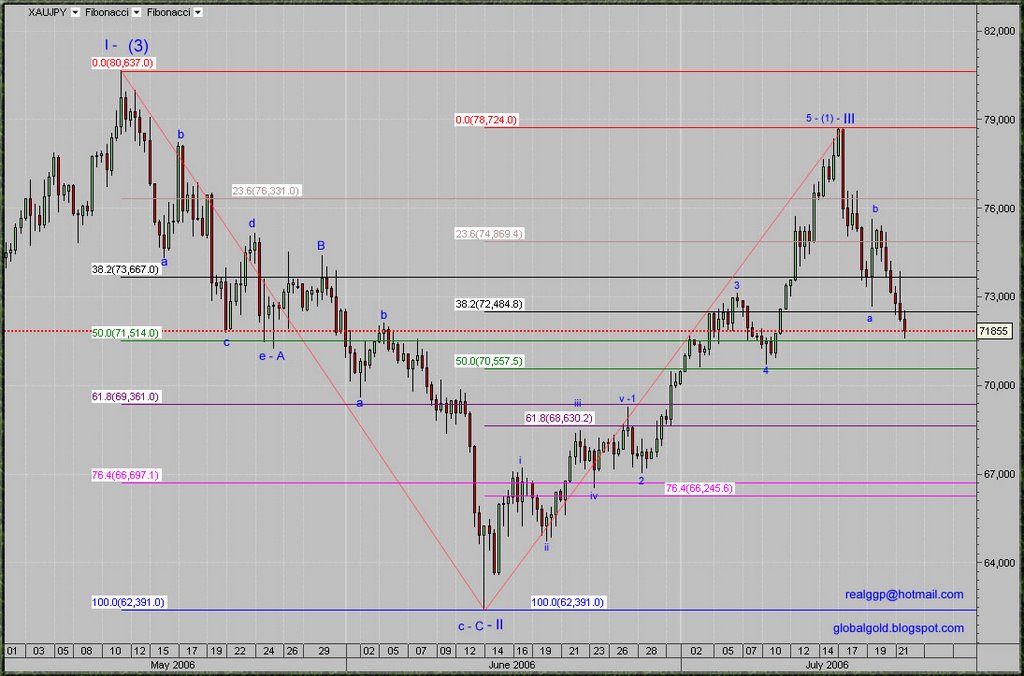
Gold/$, Gold/€ & Gold/¥ - Charts and Commentary
Dear readers,
The news which directly or indirectly related to gold are usually subjective and often causing exactly the opposite from what is assumed to be logical (sell the news syndrome). Technicals on the other hand are objective, at least when viewed from numeric perspective.
I have prepared three intraday gold charts covering the short term history of Gold/$, Gold/€ & Gold/¥ exchange rates. I added two sets of Fibonacci retracement lines, top to bottom and bottom to top. All three charts are annotated with the same Elliott wave count, high correlation is easily recognized. The pattern similarity between all three charts is indicating that gold is becoming more independent, market factors which used to affect the price of gold (USD index, Euro, Crude Oil. Etc.) are loosing significance. The gold market is evolving to be more mature, the price of gold will be affected by gold market internal forces more then anything else – this is the trend in my opinion. As time goes by and as this great global gold bull market develops, I expect gold influence to grow while gold as a monetary object will be less affected and possibly much less affected by other market variables. Gold and Forex traders should closely observe this development; things that worked in the past might not work in the Future
Gold is completing or already completed its wave (2) – III correction which should be immediately followed by volatile upward movement – wave (3) – III.
I'm repeating the suggested short term bottom target for Gold/$: 613$, 608$ & 593$.
And adding suggested target for Gold/€: 484€ & 471€ and targets for Gold/¥: 71,514¥, 69,361¥ & 68,630¥.
Click on the charts below for better view.
Related:
Gold and Silver Stocks
For basic Elliott Wave Tutorial see EWI (needs free registration)
The news which directly or indirectly related to gold are usually subjective and often causing exactly the opposite from what is assumed to be logical (sell the news syndrome). Technicals on the other hand are objective, at least when viewed from numeric perspective.
I have prepared three intraday gold charts covering the short term history of Gold/$, Gold/€ & Gold/¥ exchange rates. I added two sets of Fibonacci retracement lines, top to bottom and bottom to top. All three charts are annotated with the same Elliott wave count, high correlation is easily recognized. The pattern similarity between all three charts is indicating that gold is becoming more independent, market factors which used to affect the price of gold (USD index, Euro, Crude Oil. Etc.) are loosing significance. The gold market is evolving to be more mature, the price of gold will be affected by gold market internal forces more then anything else – this is the trend in my opinion. As time goes by and as this great global gold bull market develops, I expect gold influence to grow while gold as a monetary object will be less affected and possibly much less affected by other market variables. Gold and Forex traders should closely observe this development; things that worked in the past might not work in the Future
Gold is completing or already completed its wave (2) – III correction which should be immediately followed by volatile upward movement – wave (3) – III.
I'm repeating the suggested short term bottom target for Gold/$: 613$, 608$ & 593$.
And adding suggested target for Gold/€: 484€ & 471€ and targets for Gold/¥: 71,514¥, 69,361¥ & 68,630¥.
Click on the charts below for better view.

Related:
Gold and Silver Stocks
For basic Elliott Wave Tutorial see EWI (needs free registration)
Thursday, July 20, 2006
Gold Chart Analysis - short term Update
To put it simply: Short term gold is probably going a little bit lower.
Metals prices declined today (7/20), particularly base metals.
Intraday Elliott wave count analysis implies that gold is about to complete its first serious correction since the June bottom. Upon the completion of this minor correction, the upward movement should resume. Hence the emphasis is Buy, Add & Hold.
Suggested short term price targets for spot gold (based on Fibonacci retracement levels) 613$, 608$ and 593$.
Below are daily and intraday spot gold charts , you can click on the intraday chart to enlarge.

Wednesday, July 19, 2006
Gold and Silver Intraday Charts
Dear readers,
Below are Gold and Silver Spot charts. Technically both gold and silver broke up above the downtrend resistance line and it's seems that the short term correction is over. I'm still evaluating the situation and will update later. Meanwhile you can refer to previous posts for longer term charts and observations.
See this morning HUI & GDX technical Update
Click on the charts below for enlarged view.

Monday, July 17, 2006
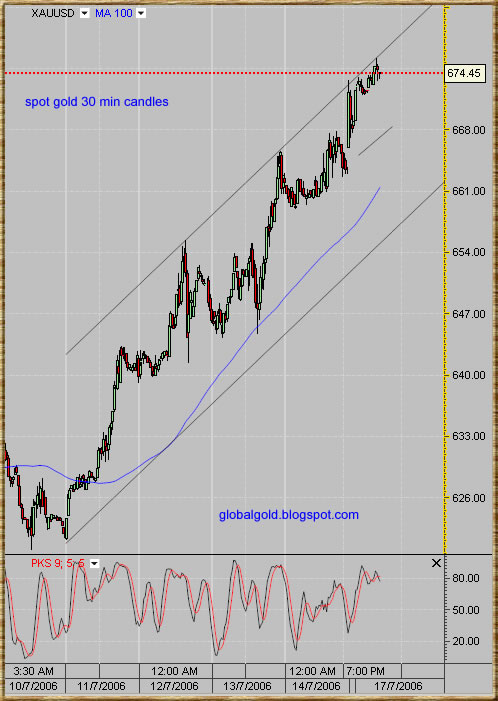
Unusual day for the Gold market.
One can write a book about today action in the gold market. However, loyal to my relatively sharp and minimal writing style (I don’t like to waste your time) here are the main points in my opinion:
- Gold opened the week with a gap up –that is bad, the gap is now closed (and then some…) and that’s good.
- New volume record of 63,471 (100 OZ) contracts for Cbot gold futures
- Geopolitical tensions are treated as a short term opportunity for profit taking when the technical situation confirm.
- This is the great global gold bull market and as long as it going, hold your core gold position.
- Watch what the mining indices are doing, watch metals prices and commodities in general.
- Expect the unexpected.
- Technically – short term I'm natural to slightly bullish. I would like to see gold quietly consolidates around current levels for a day or two.
Suggestions & Requests along relevant comments are always welcomed!
Below is 4 hours candles intraday gold spot chart with two sets of Fibonacci lines and the most relevant short term trend line. No Elliott wave count update yet. Click on the chart for larger view.

Gold short term update
This post is for short term traders only.
Gold opened the week with a gap up , this gap better be closed as soon as possible in my opinion, but it can take a few days.
Silver continue to under perform.
It is obvious that a lot of speculative short term money has entered the gold market based on the Middle East conflict; they will leave on first sign of truce.
These factors are short term negative for gold.
Sunday, July 16, 2006
EURO / USD Elliott Wave Count Analysis
R.S from Germany asked for my view on the EURO / USD exchange rate.
Please note that theoretically the EURO was as high as 1.45 USD at 1992, since then it didn't manage to make a new high.
Monthly chart shows a triangle pattern with a price objection of 1.45 by early 2009. I see a significant top labeled (v – 1) and then A correction wave to the 38.2% Fibonacci line. B top might be in place and if that’s the case - C low (lower then A) should be expected.
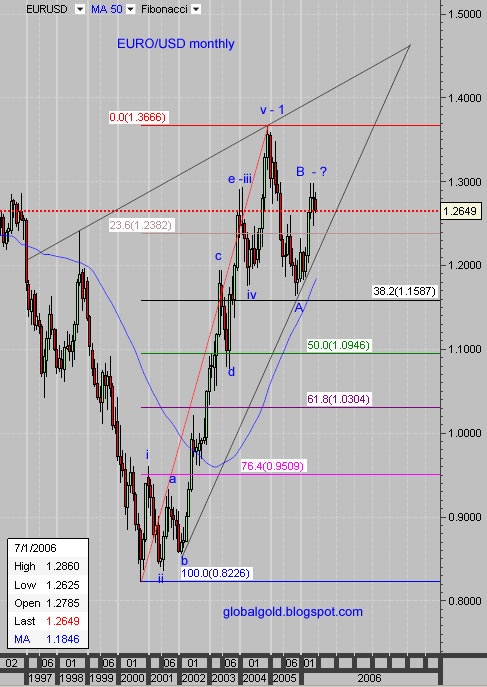
Weekly chart – more detailed wave count, currently just around the 50% Fib, the wave count further indicating a completion of a B top.
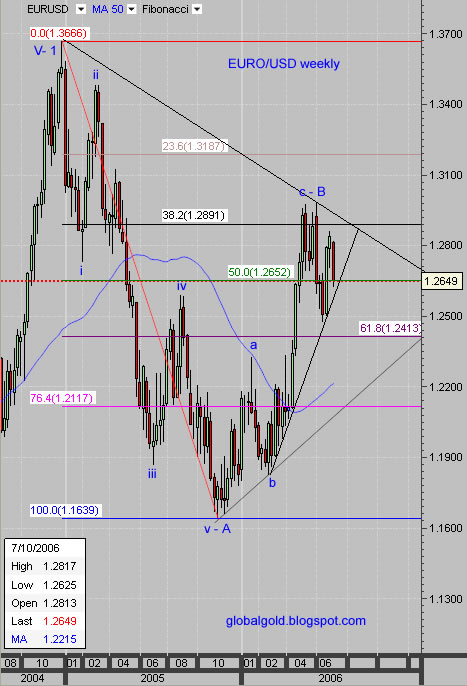
According to my Elliott wave analysis the outlook is short term bearish and long term natural to slightly bullish. A rate exchange of 1:1 (par) will not surprise me.
Related:
Gold Vs. X.
Please note that theoretically the EURO was as high as 1.45 USD at 1992, since then it didn't manage to make a new high.
Monthly chart shows a triangle pattern with a price objection of 1.45 by early 2009. I see a significant top labeled (v – 1) and then A correction wave to the 38.2% Fibonacci line. B top might be in place and if that’s the case - C low (lower then A) should be expected.
Weekly chart – more detailed wave count, currently just around the 50% Fib, the wave count further indicating a completion of a B top.
According to my Elliott wave analysis the outlook is short term bearish and long term natural to slightly bullish. A rate exchange of 1:1 (par) will not surprise me.
Related:
Gold Vs. X.
Saturday, July 15, 2006
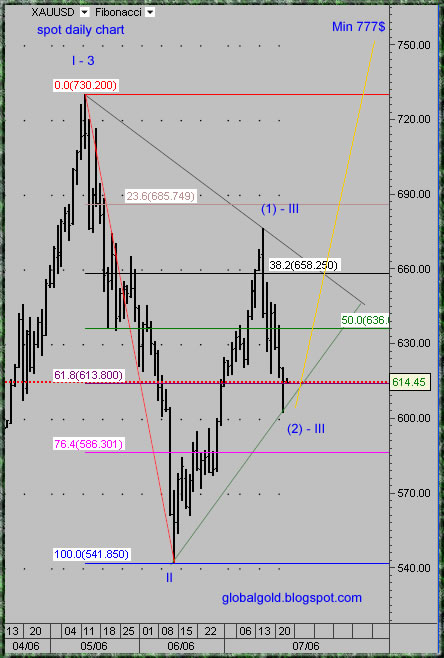
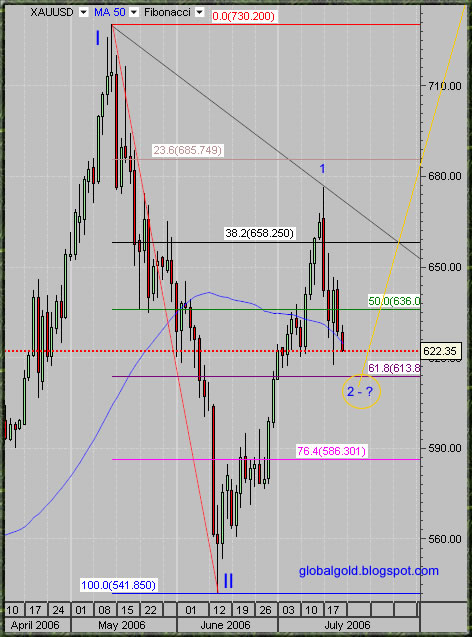
Gold – Expect the Unexpected!
Newbie Forex traders are learning the hard way that accelerating geopolitical tensions and Middle East war doesn’t (necessarily) mean lower USD index. Gold traders are learning that Higher USD Index does not equal to lower price of gold. As said before gold is and will continue to go up against each and every national currency. As I see the situation - in the short term we might witness the price of gold going up along the USD – causing maximum pain for most market participants.
This picture says it all

Below is spot gold daily chart with Fibonacci support resistance levels. Support at 658$ and 636$, resistance 685$ and 730$.
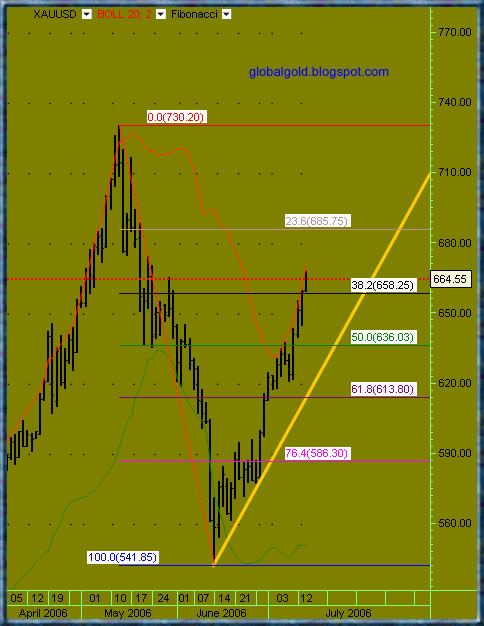
This picture says it all
Below is spot gold daily chart with Fibonacci support resistance levels. Support at 658$ and 636$, resistance 685$ and 730$.
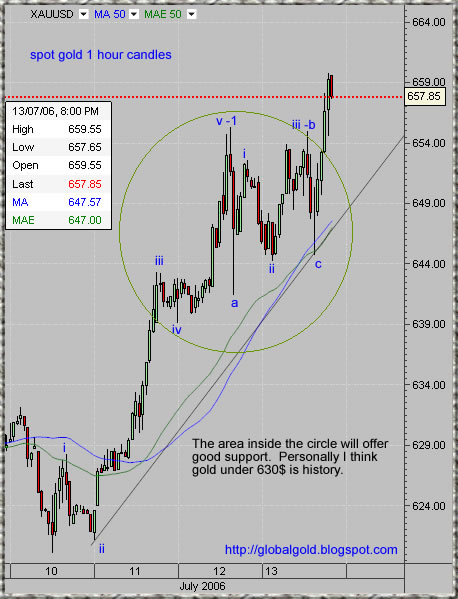
Thursday, July 13, 2006
Spot Gold Chart
Gold – more bullish then expected.
Gold continue to show strength in the face of profit taking and possible central banks sellings. Geopolitical tensions in the oil rich Middle East catalyzing the action. The price of oil WTI made another new all time high today – not surprising and quiet predicable. I'm still holding my initial price target of 81$ per barrel, and will probably revise it soon – see oil charts (WTI). If you trade gold don’t be afraid to take partial profits along the way as this Great Global Gold Bull Market has a long way to run. Going forward expect sharp and unexpected corrections along the way as well as monster technical rallies with no apparent reason – Volatility and allot of it!
Mining shares are not gold and don’t be surprised to see gold outperforming the gold indices – it is absolutely possible and also probable at some point – in my opinion.
See this page for news on what looks to me like global trend of mines / mining - nationalization.
See this short article about - Special risks when investing in a mining company
The short term (1 hour candles)chart annotated with minor wave count shows this week action. Yesterday bottom ( labeled a ) was all what the bears managed to achieve for now. Both (ii) and (c) are higher then (a) and this is bullish – correction with marginal higher lows and marginal lower highs. To understand the complete technical picture which didn't really changed today, you will have to look at previous charts.
If you have useful info please comment onsite, for personal issues please contact – RealGGP@Hotmail.com
For US DOW and SPX500 Elliot wave count see EWI
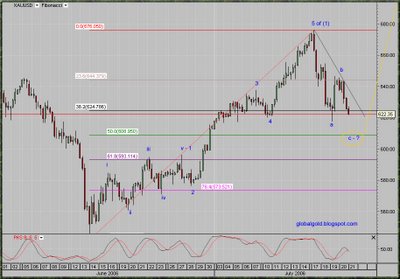
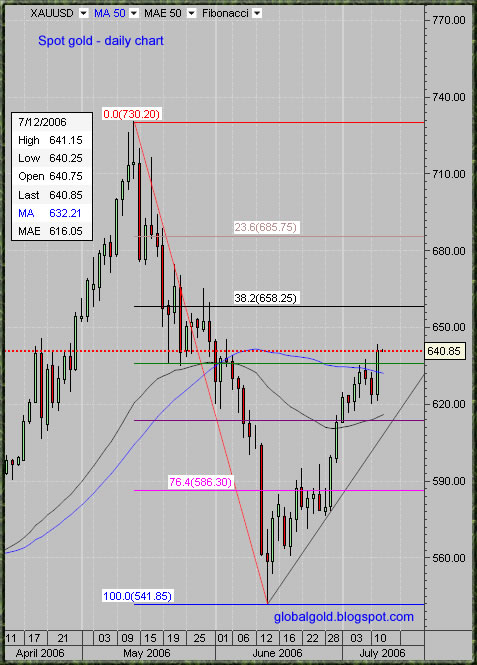
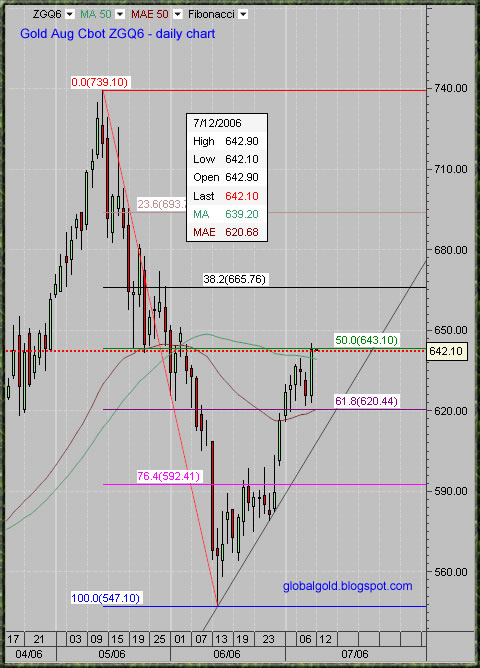
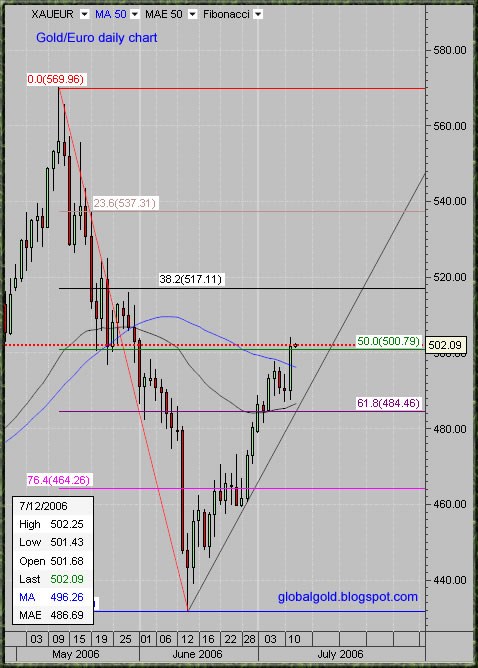
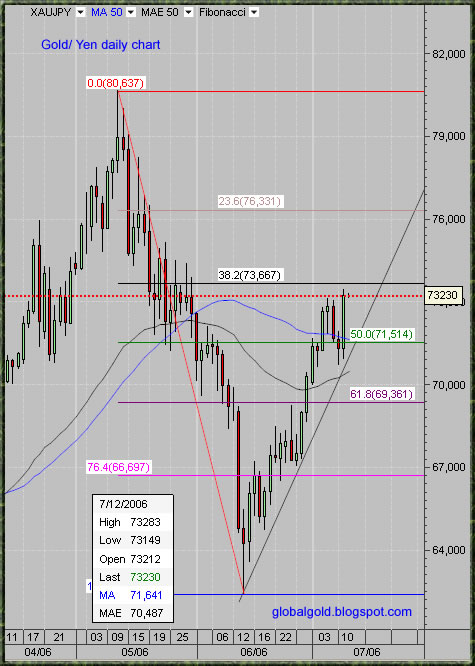
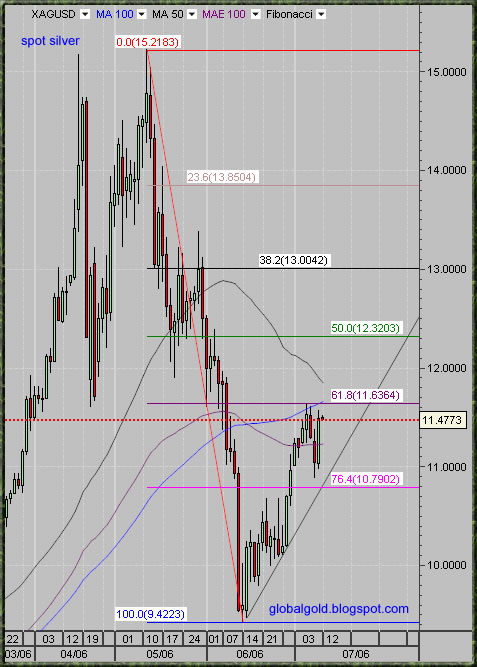
Wednesday, July 12, 2006
Gold Chart and Commentary
Gold encountered relatively strong resistance area at 656$ -658$ for the spot dollar price (38.2% Fib on the short set & 23.6% Fib on the long set –weekly chart). That’s along the relevant Fibs on GOLD/EURO & GOLD/YEN (yesterday charts). The price of gold pulled back sharply as smart traders took profits at the zone of resistance taking advantage of the hype regarding so called International tensions.
As I said before the price of gold is directly affected by pure economic and monetary factors. International tensions and terror events are not directly related to the price of gold. It's the psychology they might manufacture which can affect the short term price action. Correlated events like in India and the Middle East should be seen as a short term opportunity for profit taking when the technicals confirm.
Nevertheless, this is the Great Global Gold Bull Market and holding a long term core gold positions is a smart thing to do as timing the 24 hours gold market is extremely difficult. This is the third primary Elliott wave and as such it should be highly impulsive and extensive. The current Elliott wave is quiet complex and the outlook is bullish.
Short term 30 min chart showing this week action, minor Elliott wave count suggest a completion of impulsive wave then a counter impulsive correction (a) to the 38.2% Fib. Given the resistance at 5 (see weekly chart below) the odds favor further consolidation (c bottom) before moving higher. Traders should be patient at this point and wait for short term buying opportunity, all bets are off if the price of gold goes above 655$ – 658$ - watch out for head fakes !
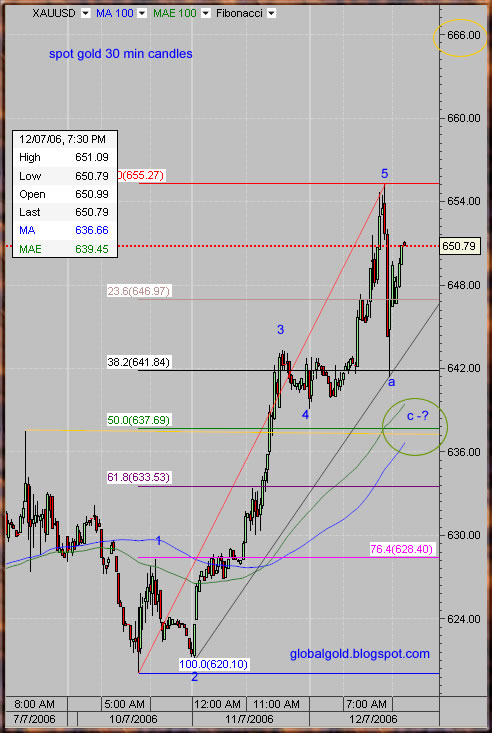
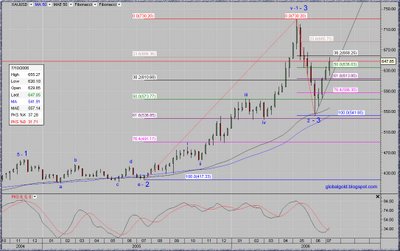
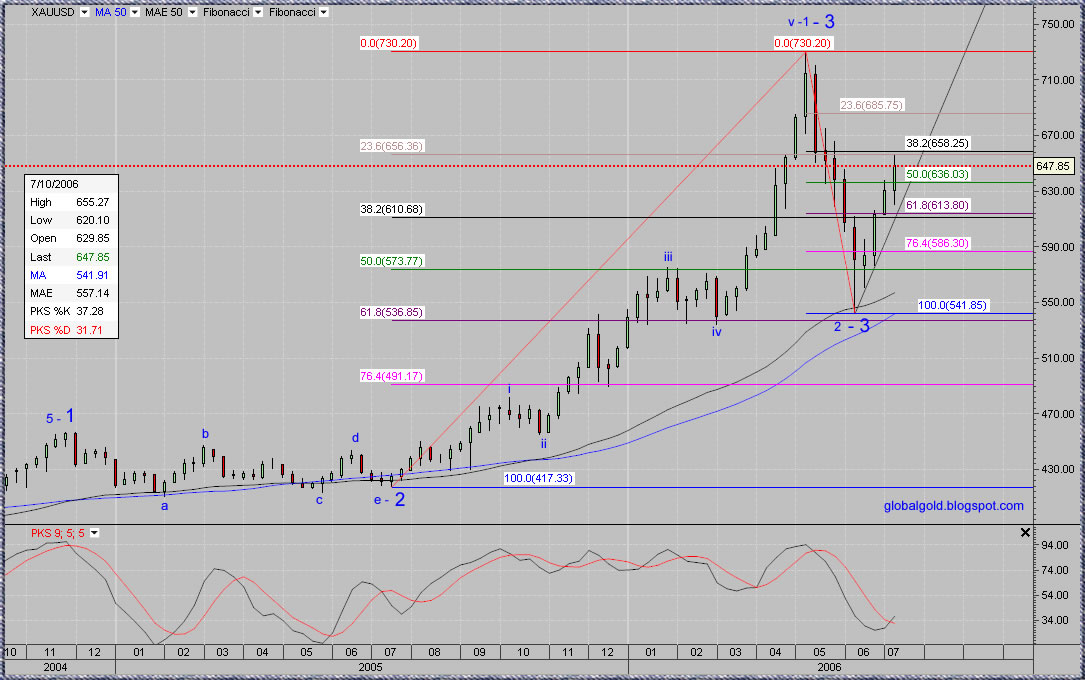
Below is the Weekly chart annotated with the wave count for the past 2 years – currently Wave 3 of 3. Click on the chart to enlarge:
As I said before the price of gold is directly affected by pure economic and monetary factors. International tensions and terror events are not directly related to the price of gold. It's the psychology they might manufacture which can affect the short term price action. Correlated events like in India and the Middle East should be seen as a short term opportunity for profit taking when the technicals confirm.
Nevertheless, this is the Great Global Gold Bull Market and holding a long term core gold positions is a smart thing to do as timing the 24 hours gold market is extremely difficult. This is the third primary Elliott wave and as such it should be highly impulsive and extensive. The current Elliott wave is quiet complex and the outlook is bullish.
Short term 30 min chart showing this week action, minor Elliott wave count suggest a completion of impulsive wave then a counter impulsive correction (a) to the 38.2% Fib. Given the resistance at 5 (see weekly chart below) the odds favor further consolidation (c bottom) before moving higher. Traders should be patient at this point and wait for short term buying opportunity, all bets are off if the price of gold goes above 655$ – 658$ - watch out for head fakes !
Below is the Weekly chart annotated with the wave count for the past 2 years – currently Wave 3 of 3. Click on the chart to enlarge:
Tuesday, July 11, 2006
Gold , Silver , Forex - chart update
First I want to offer my condolences for Indian readers who suffered horrifying terror event at the city of Bombay.
In the short term the technicals rule the price of gold. Gold was due for a bounce with or without the Bombay event (see yesterday chart).
The Aug gold future contract managed to close above its 50 DMA but is currently still struggling with the 50% Fib line. Spot gold did cross its 50 DMA as well as the 50% Fib line. Gold/Euro is back above 500 Euro, above the 50 DMA and above the 50% Fib. Gold/YEN is looking the most bullish, well above the 50 DMA and just below the 38.2% Fib. Gold/Silver ratio = ~55.64, Gold/Oil ratio =~8.64, Dow/Gold ratio =~17.38. Silver continue to lag behind - still below the 61.8% Fib and the 100 DMA.
Fib lines above the current price are resistance and Fibs below are support, the same goes for moving averages(see charts below).
Zimbabwe: RBZ Eyes Gold Mine
THE Reserve Bank of Zimbabwe is reportedly eyeing a controlling stake in Globe and Phoenix Mine in a desperate bid to improve Zimbabwe's dwindling foreign currency reserves.
Sources told this paper that the Kwekwe-based gold mine was one of the projects that the Central Bank was eyeing with monetary authorities already having begun talks with unnamed horticultural producers for possible acquisitions. -source
By the way, anyone can copy my charts but please provide link and mention the source.
EWI are kind to offer free week(12 -19 July) of : Intraday Forecasts of US Stocks and EWI Financial Forecast Service- this service usually cost 6000$ a year , so this is a 115$ Free trail – check it out –( you only need to provide email and user name)
ScotiaMocatta Precious Metals Report
ScotiaMocatta is a leading Canadian bullion bank with International presence.
Scotia is a London gold fixing member along HSBC , Deutsche Bank, Societe Generale and Barclays Capital.
ScotiaMocatta July 2006 Precious Metals Report
Scotia is a London gold fixing member along HSBC , Deutsche Bank, Societe Generale and Barclays Capital.
ScotiaMocatta July 2006 Precious Metals Report
Monday, July 10, 2006
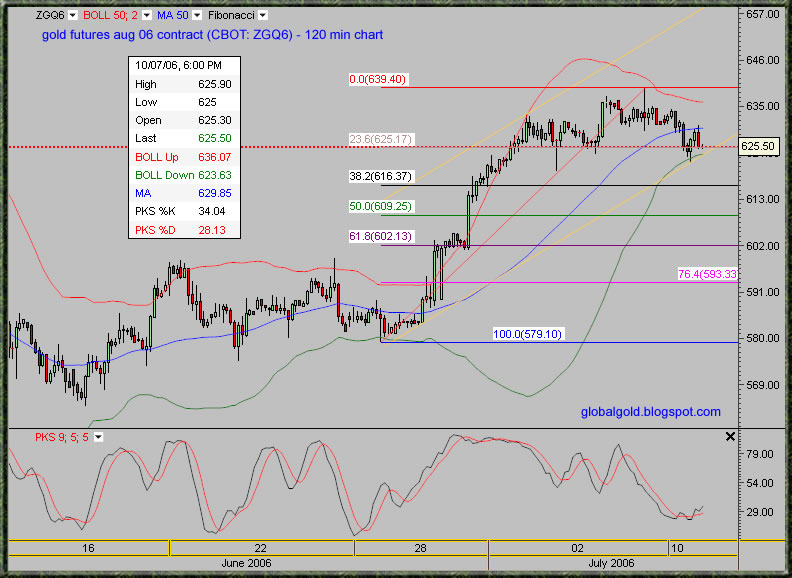
Gold Futures Intraday Chart
The August Gold contract (CBOT : ZGQ6) pulled back 17.70$ since last week high, gold hit the lower Bollinger band (50 MA; STD = 2). Notice that the bands are tightening again and the stochastic indicator is turning bullish. Good chance that a short term bottom is in place and the price of gold is headed back up to challenge its 50 DMA. The action is practically similar for spot gold. Click on the chart to enlarge:

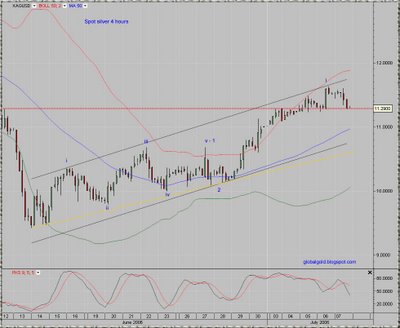
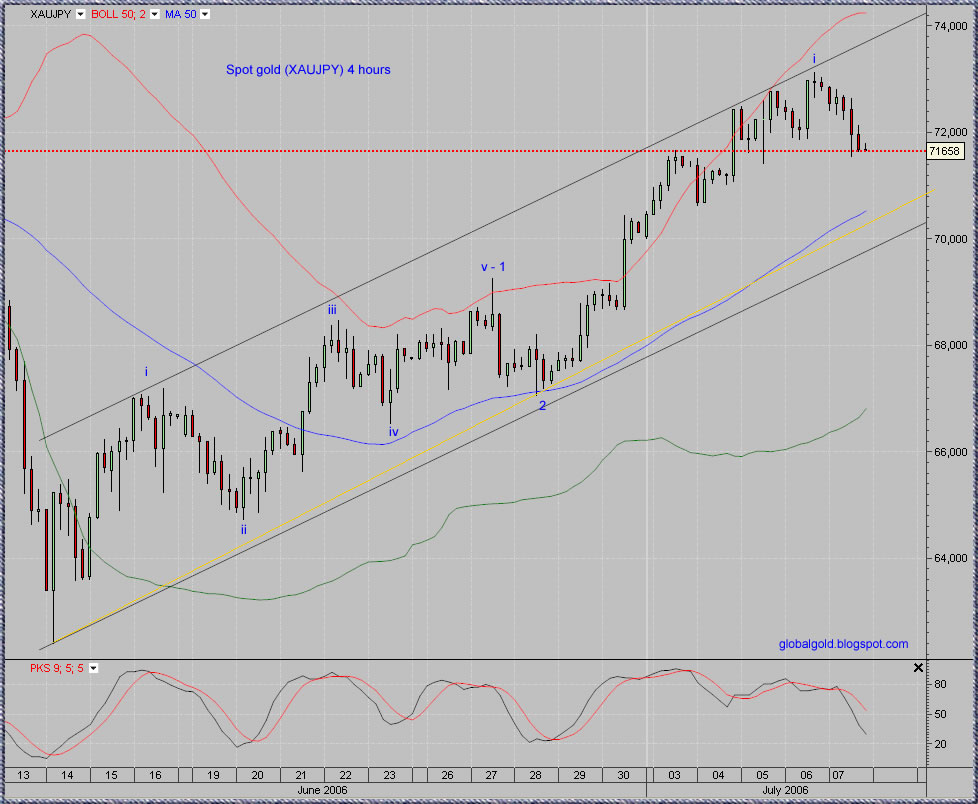
Sunday, July 09, 2006
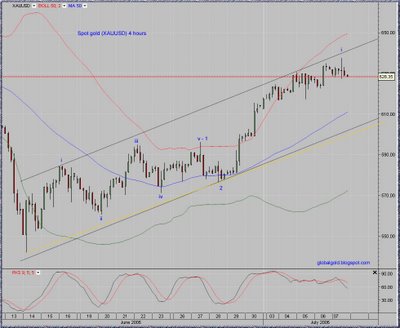
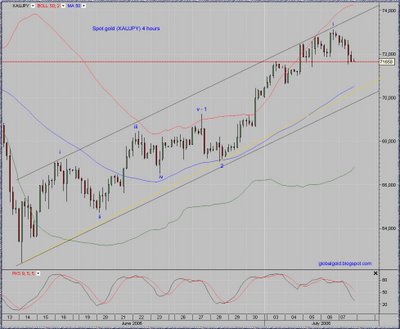
Gold, Silver & Forex Intraday Elliott Wave Count
Gold encountered its 50 DMA and the 50% Fib level then pulled back slightly. Silver encountered its 100 DMA and the 61.8% Fib and pulled back a bit. Currently the odds favor a bit of short term consolidation for gold and silver - just below the 50% and the 61.8% Fibs respectively.
Investors & Traders need not worry as I do not expect a pullback to be deep. Shorts, hedgers and those with no gold or silver holdings should use any weakness and buy aggressively. My wave count analysis on all time frames implies that gold is at extremely bullish phase, shorting is a death wish!
Below are intraday charts for Gold/USD (XAUUSD), Gold/EURO (XAUEUR), Gold/YEN (XAUJPY) & Silver (XAGUSD). All wave counts are synchronized indicating high reliability. (Click on the charts to enlarge)
Related:
Palladium Futures (NYMEX: PL) Chart Analysis
Gold and Silver stocks charts reviews


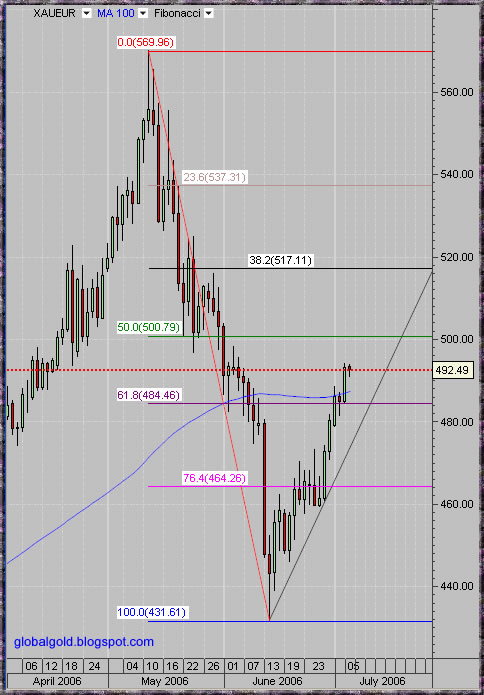
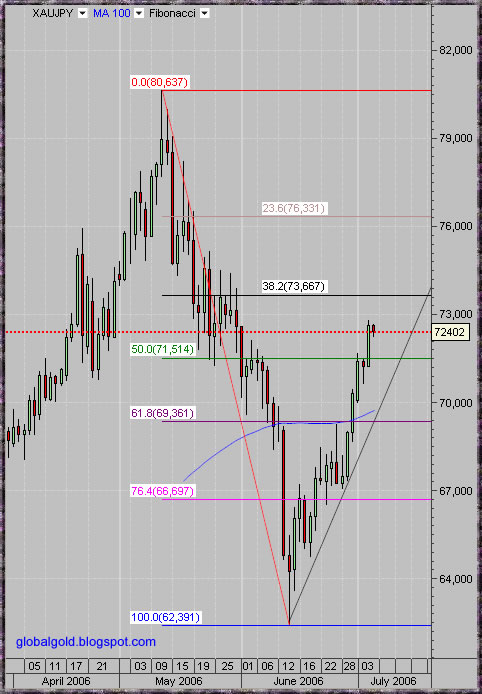
Thursday, July 06, 2006
Gold, Silver & Industrial Metals - Charts
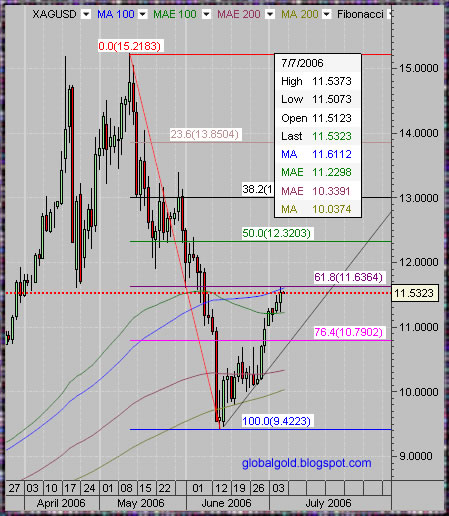
Spot gold moved higher to test the 50 daily moving average (DMA) and the 50% Fibonacci line. Gold formed a V bottom that few predicted. The trend line on the spot gold daily chart below implies that gold will make new multi year high no later then mid September. Obviously the 61.8% Fib zone which currently coincide with the 50 daily exponential moving average (EMA or MAE) will offer good support in case of an impending pullback.
The price of silver is currently lagging gold and the trend line is less steep – however that can change real quickly. Silver moved up to test the 61.8% Fib which coincide with the 100 DMA. The trend line on the spot silver chart implies new multi years high no later then the end of October.
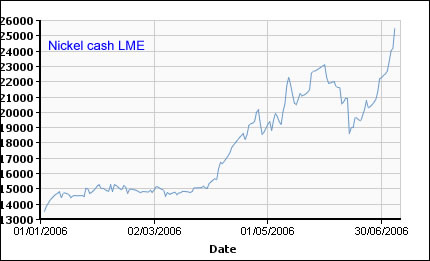
The Dow Jones-AIG Industrial Metals Index (aluminum, copper, zinc and nickel) is up 5% today - outperforming both gold and silver by a wide margin.
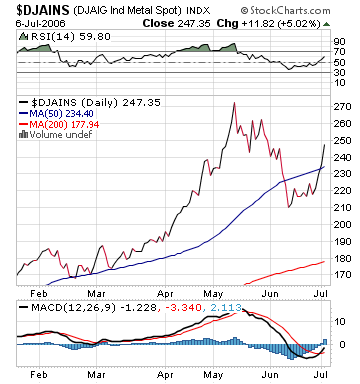
The price of silver is currently lagging gold and the trend line is less steep – however that can change real quickly. Silver moved up to test the 61.8% Fib which coincide with the 100 DMA. The trend line on the spot silver chart implies new multi years high no later then the end of October.
The Dow Jones-AIG Industrial Metals Index (aluminum, copper, zinc and nickel) is up 5% today - outperforming both gold and silver by a wide margin.
Wednesday, July 05, 2006
GOLD / EURO / YEN
Technically - Not much change from yesterday. Offline and online forex traders should take a deep look at these charts:
See: Gold and Silver stocks - chart reviews
See: Gold and Silver stocks - chart reviews
Tuesday, July 04, 2006
Gold and Central Banks
S.P from India Submits:
" I like your blog a lot and visit it to see your charts to guess the gold moves. I don't trade futures but interested in buying gold.
But presently, there seem to be no signs that the world will ever move towards a gold standard. The problems of the world itself are so huge to even think of going in that direction. The easier solution is being adopted and everyone is using their printing presses :)
I saw recently that even India increased money supply by 20% this year.
Do you see the gold breaking the 540 support in the next 1 year? The recent jump from support was gr8. I read somewhere that the recent dump, came because the British government decided to sell its gold partly, do you agree to it? "
India is a major power in the global economy particularly in the gold market. As most readers probably know India is the world's largest market for physical gold.
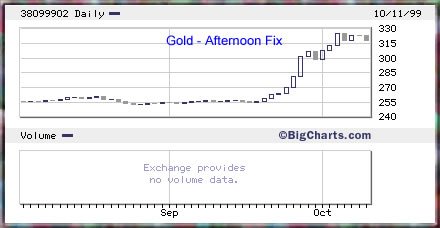
Central Banks are actively participating in the gold market, some as sellers and some as buyers. The European Central Banks have signed several agreements regarding gold selling. The first agreement was signed at September 1999 and ignited a strong rally(see chart below).
The UK signed the first Agreement but not the second (at the time the second Agreement was announced it stated that the UK government has no plans to sell gold).
I did not notice any press release regarding new UK gold sales so I can't agree with rumors. But they can certainly sell secretly (If they got any gold left)
OFFICIAL AGREEMENTS ON GOLD
Other Central Banks like Russia, China and UAE are buying or at least talking about buying gold.
Overall Gold continues to play an important monetary role and its importance is increasing along price - in my opinion. Yes, you are right, currently there is no sign of officially going back to the gold standard. However, one should not rule out a renewed gold standard or something similar.
Mr. Gary Dorsch published an interesting article which shows some interesting relations between global assets prices and gold. I had also posted about this subject and you can freely browse this blog archive.
See also : The importance of the Dow Jones / Gold, Gold / Oil & Gold / Silver ratios
Latest gold market headlines:
China, Raise gold holdings
China should take advantage of any weakness in bullion prices to build up its official gold holdings as part of a strategy for diversifying its foreign exchange reserves, a senior government economist said Monday.
Tuesday, July 04, 2006
China should take advantage of any weakness in bullion prices to build up its official gold holdings as part of a strategy for diversifying its foreign exchange reserves, a senior government economist said Monday.
Xia Bin, head of the financial research institute of the Development Research Center, a think tank under the Cabinet, also proposed that Beijing allow the yuan to fluctuate within a wider range against the dollar.
"It is practical for China to increase its holdings of gold by choosing an appropriate time to buy, because compared with other big trading countries the percentage of gold in China's reserves is seriously low," Xia said in an article on his agency's Web site.
Xia also suggested China establish an international investment fund with the aim of increasing returns from its US$900 billion-plus (HK$7.02 trillion) stockpile of reserves.
Chinese individuals should be permitted to buy into the fund, which would allow them to hold foreign exchange indirectly, he wrote. -source
Bank of Portugal sells 15 tonnes of gold
07/04/06 11:12 am (GMT)
LISBON (AFX) - The Bank of Portugal said it has sold 15 tonnes of gold from its reserves in the last few months.
The bank said the sales were aimed at diversifying its external reserves, with the proceeds to be kept in a special reserve at the central bank.
Last December, the bank sold 10 tonnes of gold.
The sales were carried out as part of the European Central Bank's agreement on gold sales which limits annual gold sales to 500 tonnes up to 2009. -source
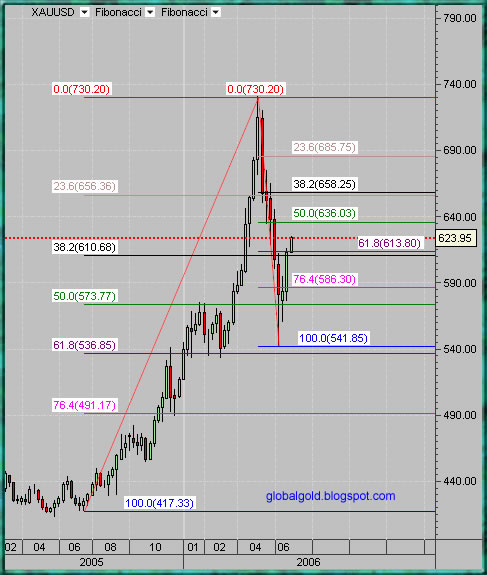
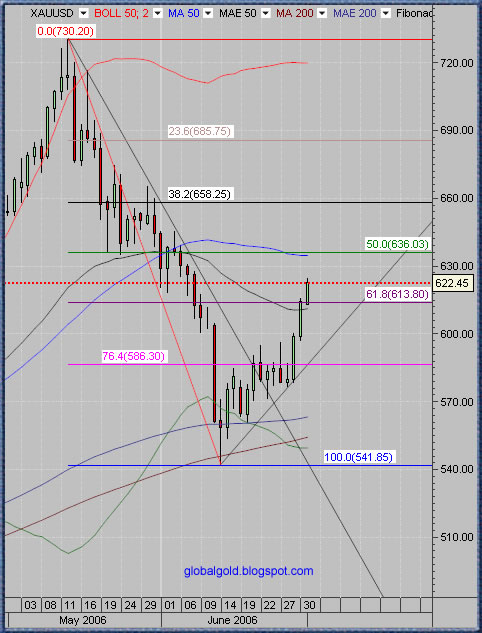
Technically the daily chart from two days ago shows a Three White Soldiers - Bullish reversal pattern (high reliability)
If you look at the weekly spot gold chart below what I see is a relatively good support between the 61.8% fibonnaci line on the short set and the 38.2% on the long set (610$ -613$). If that support doesn’t hold then gold will probably go down to the lower Fibonacci lines (573$ - 586$). Slight resistance around 636$ and more resistance at 656$ - 658$.
" I like your blog a lot and visit it to see your charts to guess the gold moves. I don't trade futures but interested in buying gold.
But presently, there seem to be no signs that the world will ever move towards a gold standard. The problems of the world itself are so huge to even think of going in that direction. The easier solution is being adopted and everyone is using their printing presses :)
I saw recently that even India increased money supply by 20% this year.
Do you see the gold breaking the 540 support in the next 1 year? The recent jump from support was gr8. I read somewhere that the recent dump, came because the British government decided to sell its gold partly, do you agree to it? "
India is a major power in the global economy particularly in the gold market. As most readers probably know India is the world's largest market for physical gold.
Central Banks are actively participating in the gold market, some as sellers and some as buyers. The European Central Banks have signed several agreements regarding gold selling. The first agreement was signed at September 1999 and ignited a strong rally(see chart below).
The UK signed the first Agreement but not the second (at the time the second Agreement was announced it stated that the UK government has no plans to sell gold).
I did not notice any press release regarding new UK gold sales so I can't agree with rumors. But they can certainly sell secretly (If they got any gold left)
OFFICIAL AGREEMENTS ON GOLD
Other Central Banks like Russia, China and UAE are buying or at least talking about buying gold.
Overall Gold continues to play an important monetary role and its importance is increasing along price - in my opinion. Yes, you are right, currently there is no sign of officially going back to the gold standard. However, one should not rule out a renewed gold standard or something similar.
Mr. Gary Dorsch published an interesting article which shows some interesting relations between global assets prices and gold. I had also posted about this subject and you can freely browse this blog archive.
See also : The importance of the Dow Jones / Gold, Gold / Oil & Gold / Silver ratios
Latest gold market headlines:
China, Raise gold holdings
China should take advantage of any weakness in bullion prices to build up its official gold holdings as part of a strategy for diversifying its foreign exchange reserves, a senior government economist said Monday.
Tuesday, July 04, 2006
China should take advantage of any weakness in bullion prices to build up its official gold holdings as part of a strategy for diversifying its foreign exchange reserves, a senior government economist said Monday.
Xia Bin, head of the financial research institute of the Development Research Center, a think tank under the Cabinet, also proposed that Beijing allow the yuan to fluctuate within a wider range against the dollar.
"It is practical for China to increase its holdings of gold by choosing an appropriate time to buy, because compared with other big trading countries the percentage of gold in China's reserves is seriously low," Xia said in an article on his agency's Web site.
Xia also suggested China establish an international investment fund with the aim of increasing returns from its US$900 billion-plus (HK$7.02 trillion) stockpile of reserves.
Chinese individuals should be permitted to buy into the fund, which would allow them to hold foreign exchange indirectly, he wrote. -source
Bank of Portugal sells 15 tonnes of gold
07/04/06 11:12 am (GMT)
LISBON (AFX) - The Bank of Portugal said it has sold 15 tonnes of gold from its reserves in the last few months.
The bank said the sales were aimed at diversifying its external reserves, with the proceeds to be kept in a special reserve at the central bank.
Last December, the bank sold 10 tonnes of gold.
The sales were carried out as part of the European Central Bank's agreement on gold sales which limits annual gold sales to 500 tonnes up to 2009. -source
Technically the daily chart from two days ago shows a Three White Soldiers - Bullish reversal pattern (high reliability)
If you look at the weekly spot gold chart below what I see is a relatively good support between the 61.8% fibonnaci line on the short set and the 38.2% on the long set (610$ -613$). If that support doesn’t hold then gold will probably go down to the lower Fibonacci lines (573$ - 586$). Slight resistance around 636$ and more resistance at 656$ - 658$.
Monday, July 03, 2006
XAUUSD Chart, Gold & Silver News
The UAE Dirham is officially pegged to the US dollar at 3.6725 Emirati dirhams per 1 US dollar since February 2002. Reserves of foreign exchange and gold are estimated at 23.53 billion USD (2005 CIA data)
UAE Central Bank set to enter the gold market
The UAE Central Bank Governor this week gave his strongest hint yet that the emirates will shortly enter the gold market and also purchase euros as a diversification of the national currency reserves presently held in US dollars. With the US dollar ripe for devaluation this seems a timely initiative.
The Governor of the UAE Central Bank, Sultan bin Nasser Al Suwaidi told reporters this week that the bank was preparing to convert up to 10 per cent of its currency reserves into gold, although he said that the bank currently held very little gold in its reserves.
'I don't think it is appropriate to buy gold now - it is too expensive. The appropriate time might come very soon. We could go up to 10 per cent,' he said. -source
Shanghai Gold Exchange is about to introduce silver trading for the first time
The regulatory framework for trading silver contracts will be completed as early as next month, said Tong Gang, the exchange's spokesperson.
The launch underscores the rapid development of the silver market in China, which is widely regarded as potentially the most important consumer, producer and exporter of the metal.
The exchange, which currently deals with platinum as well as gold, is expected to trade silver spot and spot-deferred contracts.
Spot contracts are ones that require payment at the time of purchase; spot-deferred contracts require payment a few days after the contract has been made.
Silver futures contracts could also be traded on the exchange.
The country's silver consumption, mainly used by electronics and chemical firms, was estimated at 2,600 tons last year. This compares with only 900 tons two decades ago.
The country is also an important producer and exporter of the metal. -source
See Copper TA Update
Below is gold spot daily chart:
Subscribe to:
Posts (Atom)
