Saturday, March 31, 2007

Nanotechnology

Gold Nanoparticles May Simplify Cancer Detection


Gold nanoparticles stick to cancer cells and make them shine.

Gold Nanoparticles

source


Gold Nanoparticles Show Anti-cancer Potential

Spots of blue indicate where the cancer cells have been killed by a laser. Using gold nanoparticles to indentify malignant cells weakens them, reducing the amount of laser power needed to kill them and allowing healthy cells to get by unscathed.


source


Gold nanoparticles to trap toxins


Tiny particles of gold could soon be helping to spot viruses, bacteria and toxins used by bio-terrorists.


source


Research to combat biological warfare

"The technique is based on the coating of metal nanoparticles with different sugars that recognise particular biological substances. The substance binds to the sugar, which causes a solution containing the nanoparticles to change colour (e.g. gold particles turn from red to blue), revealing the presence of the substance."


source

Friday, March 30, 2007

Au Bull Market Update

The monthly chart certainly look positive as the long term stochastic emerge off bottom.


XAU USD Monthly Log Chart:

Bull Market Update

Thursday, March 29, 2007

XAUUSD - Waves Chart

Dear readers,

All the recent short term trend lines were violated so no trade lines for today chart.

Few days ago I posted a chart and wrote:


The current short term chart pattern is a perfect example of the limitation in Elliott wave analysis: Is it (A-B-C) uptrend pattern or a five wave pattern?


Given the recent technical action it seems to me that the second choice is more likely to be in play. Which means that the sub wave is a 5 waves pattern. (Currently wave [iii] is underway) So, this is my opinion but I wouldn't necessarily speculate on that.

I hope none of you concluded that Elliott Waves Analysis is useless as this is certainly not the case. In my opinion Wave analysis is excellent instrument to have in your technical analysis toolbox. If you have no idea what wave analysis is all about, you might want to look at this free waves guide.

XAUUSD Intraday 24hr 2hr bar chart.

XAUUSD Intraday chart

Quick HUI Update

Wednesday, March 28, 2007

XAUUSD Chart

Dear readers,

Gold pulled back a bit but held at key Fibonacci levels , as things stand out gold might not touch the lower uptrend line , I have annotated the XAUUSD chart with a new uptrend line , the new uptrend is steeper and suggest that gold can accelerate to the upside. Click on the chart below to enlarge.


Spot Gold (XAUUSD) Intraday chart:

<br />Spot Gold chart

Monday, March 26, 2007

XAUUSD Update

The short term uptrend was broken on Friday. Gold and silver are currently vulnerable for more downside. Successful retest of the uptrend line should be a short term buying opportunity. Enlarge chart for better view.

XAUUSD intraday chart

XAUUSD intraday chart

Wednesday, March 21, 2007

XAU/USD Intraday

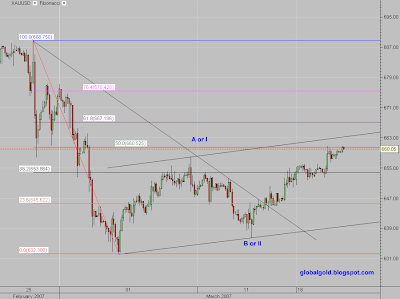
Gold followed silver for a new monthly (March) high. The top to bottom chart is annotated with Fibonacci levels and the uptrend channel. All action options are open but the action will be dependent on options...

The current short term chart pattern is a perfect example of the limitation in Elliott wave analysis: Is it (A-B-C) uptrend pattern or a five wave pattern?


XAU/USD Intraday ( 120 min) Chart


xauusd intraday

Saturday, March 17, 2007

Gold & Silver Charts

Dear readers,

The price action of gold was somewhat mild recently as the money metal consolidated around its 50 days moving average. The uptrend which connects the October 2006 and January 2007 lows is still intact, additional support levels at the 200 daily MA and a bit above the January low. In my opinion there isn't much conviction yet as if another leg up will begin from here or is further decline might be required. Silver is looking to me a little bit stronger but not much strong either. The HUI is indecisive at best and lately I was bubbling something about the approach of long term buy & hold commodities?


gold daily chart


silver daily chart

Tuesday, March 13, 2007

¥ Japanese Yen Long Term Chart Analysis

The Yen Is a hot topic lately and so called "Experts" decided that the Yen is to be blamed for the recent volatility hiccup of the global markets. Well, it is true that gold in term of yen made a new 20 plus year high just recently whereas in terms of USD and Euro it did not. This fact might be important to remember.

As for the USD/JPY pair?

Let's put aside the carry trade and interest rates and look at the charts.

From the 30 years chart we can learn that the Yen bottomed / USD topped at 1982 some 25 years ago! Back then 1 USD was worth about 277 Yen. Between 1982 and 1995 the USD declined to about 79 Yen for a loss of about 71%. Note that the 13 years decline was done in a three wave pattern. According to my count the USD/JPY is currently in wave (iii) and headed higher then 135 – wave (i). If you need a basic wave guide I highly recommend that you use this free Elliott wave tutorial.

Note that the 50 month MA is as stable as ever and volatility is relatively low for the last decade as the pair still trades between the 1995 low and the 1998 high. The USDJPY pair might be breaking up from a long term symmetrical triangle.


30 Years USDJPY Chart.

USDYPY Chart long term chart


Japanese Yen / US Dollar 1994 - 2007

USDJPY Chart

Wednesday, March 07, 2007

Spot Gold Charts Update

Gold, Silver and precious metals shares continue to recover today. As I see the situation the metals must be a better long term buy after last week drop, however I'm not totally convinced that the bottom of the move is in so traders should be cautious with leveraged short term positions.

Uptrend channel still intact on the daily XAUUSD chart.

XAUUSD chart


Spot gold Intraday chart, 2 hours candles with Fibonacci retracement levels.

Spot gold Intraday chart

Monday, March 05, 2007

Gold, Silver Update

Dear Readers,

One can notice the extreme bullish sentiment quickly vanishing. From a technical perspective the downtrend is decelerating but that can quickly change. Gold finds some temporary support at key Fibonacci levels. Silver behave the same as gold with a little more upside / downside kick. The weekly indicators are ok, daily still bearish and the intraday are mixed (some positive, some negative). I'm attaching a one year daily spot silver (XAGUSD) chart annotated with Fibonacci levels; see previous posts for identical gold chart if needed. Enlarge chart for better view.

daily spot silver (XAGUSD) chart

Saturday, March 03, 2007

Gold Chart Analysis

Believe it or not this correction is not meaningful when viewed from a cycle analysis point of view, such as Elliott wave count.

I have tried to warn you in the several last posts and I hope that at least some of you took profit on speculative short term positions.

Long term positions should not be affected at all and anyone should be aware that those steep and sudden sell offs will repeat from time to time.

As you can see on the short term gold chart below - gold is retracing its 2007 advance. The price of gold is already down about 50$ from the latest top. Gold closed the week below the 50% Fibonacci line and the 50 days moving average. Don’t be surprised to see more short term downside, Pay attention to the 200 days moving average and the 76.4% Fibonacci level.

gold price chart


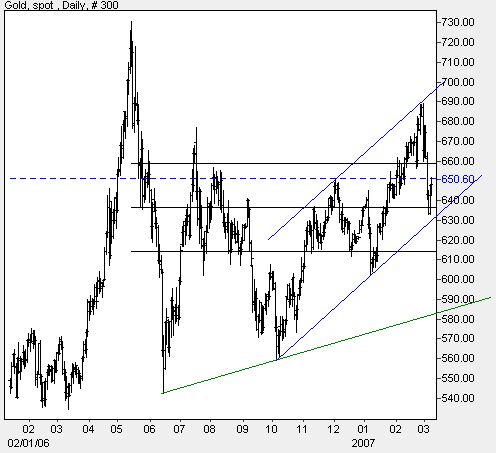
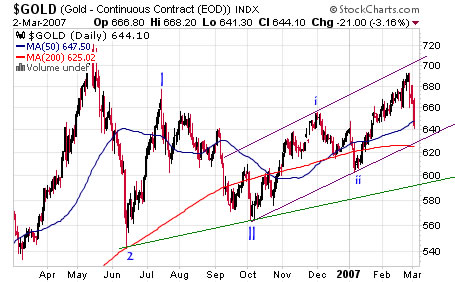
Looking at the one year chart, note that the price of gold is still inside the uptrend channel. The channel which begun at October 2006 is valid but it is not as meaningful as this year low (labeled ii). There is one more noticeable uptrend line connecting the June and October 2006 lows.

gold daily chart

Search

SUBSCRIBE

Gold Global Perspective Feed

AddThis Social Bookmark Button AddThis Feed Button

Labels