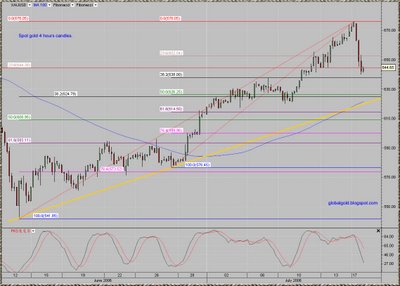
One can write a book about today action in the gold market. However, loyal to my relatively sharp and minimal writing style (I don’t like to waste your time) here are the main points in my opinion:
- Gold opened the week with a gap up –that is bad, the gap is now closed (and then some…) and that’s good.
- New volume record of 63,471 (100 OZ) contracts for Cbot gold futures
- Geopolitical tensions are treated as a short term opportunity for profit taking when the technical situation confirm.
- This is the great global gold bull market and as long as it going, hold your core gold position.
- Watch what the mining indices are doing, watch metals prices and commodities in general.
- Expect the unexpected.
- Technically – short term I'm natural to slightly bullish. I would like to see gold quietly consolidates around current levels for a day or two.
Suggestions & Requests along relevant comments are always welcomed!
Below is 4 hours candles intraday gold spot chart with two sets of Fibonacci lines and the most relevant short term trend line. No Elliott wave count update yet. Click on the chart for larger view.


1 comment:
One of the things that I like to do is look at some other metals commodity chart such as copper. I do this in order to get some clues as to what could be expected for the price action in gold. Case in point, here is a daily chart on copper:
[Link]
In this chart, there is a three wave decline from the high in copper. However, the rally from the low looks like it can counted as either a 5-wave rally or a 3 wave rally. On a five wave count, we can expect copper to correct to some level between 320 and 340. However, on a 3 wave rally, copper can instead retrace back to 260 to 280.
Of the three metals charts (copper, gold, and silver), copper appears to be the strongest in terms of relative strength.
When looking at silver, the retracement off of the lows is much weaker than that of gold or copper.
[Link]
Silver also shows the same large three wave decline as copper. I think what this is suggesting is yet another large three wave decline from the peak of the 9.50 to 12.00 bounce for silver.
So it appears that the price correction for the metals market is still ongoing in which copper leads gold, and gold leads silver.
Thus, the larger pattern then looks like a double zigzag that is still in progress for all three metals markets.
Post a Comment