


Gold continue to show strength in the face of profit taking and possible central banks sellings. Geopolitical tensions in the oil rich Middle East catalyzing the action. The price of oil WTI made another new all time high today – not surprising and quiet predicable. I'm still holding my initial price target of 81$ per barrel, and will probably revise it soon – see oil charts (WTI). If you trade gold don’t be afraid to take partial profits along the way as this Great Global Gold Bull Market has a long way to run. Going forward expect sharp and unexpected corrections along the way as well as monster technical rallies with no apparent reason – Volatility and allot of it!
Mining shares are not gold and don’t be surprised to see gold outperforming the gold indices – it is absolutely possible and also probable at some point – in my opinion.
See this page for news on what looks to me like global trend of mines / mining - nationalization.
See this short article about - Special risks when investing in a mining company
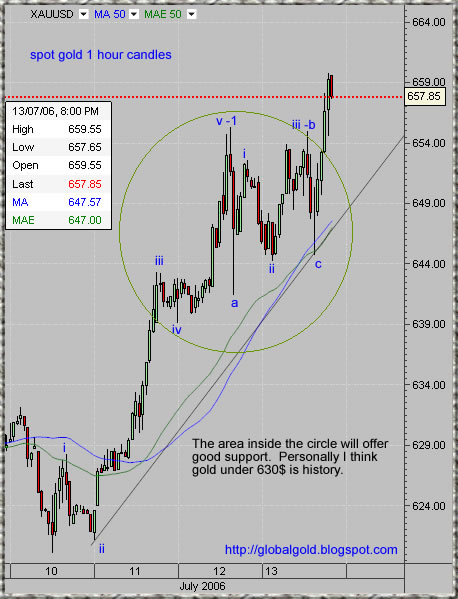
The short term (1 hour candles)chart annotated with minor wave count shows this week action. Yesterday bottom ( labeled a ) was all what the bears managed to achieve for now. Both (ii) and (c) are higher then (a) and this is bullish – correction with marginal higher lows and marginal lower highs. To understand the complete technical picture which didn't really changed today, you will have to look at previous charts.
If you have useful info please comment onsite, for personal issues please contact – RealGGP@Hotmail.com
For US DOW and SPX500 Elliot wave count see EWI

No comments:
Post a Comment