Tuesday, January 31, 2006

Gold spot 4 hours chart

The precious metals market is reorganizing itself in an orderly meaner and all steps are being made to allow much higher natural prices.

As I said before there is no need to fight the Forex of nature and gold is no one enemy but it could certainly be everyone savior.

Hence my bias continue to be to the up side, and the look is after bottoms, not tops!

Technically the channel chart is still intact; you can click on the chart below to enlarge:


gold spot chart

Sunday, January 29, 2006

Silver Elliot wave count

Counting waves is never easy and there is always more then one possibility, more so for silver.

Please click on the chart below to enlarge the experimental Elliot wave count for Silver.

Silver Elliot wave count

Saturday, January 28, 2006

Gold Wave count

This week gold didn't do much in terms of price but it proved itself comfortable at current levels. The USD Index had a good week so the gold performance in Euro, Yen. Etc was actually better. (Usually there is no need to pay much attention to the managed Forex casino)
I have annotated a daily gold chart with Forks and wave count covering the start of the second wave.

Click on the chart below to enlarge:


Gold Wave count

Thursday, January 26, 2006

Golden toughts…

Why fight the forex of nature? As we all know the ESF is a leading force in the gold market. Now we all have to ask our selves – what happen when the ESF decide to change position and close all of its short positions and go long? After all the gold market at much higher levels will have the capacity to accommodate much of the paper liquidity plus the Fed should still be the largest gold bug on earth.

Link to ESF

Wednesday, January 25, 2006

Silver Breakout

Good day for the precious metals, Platinum made an all time high, Silver broke out of a triangle pattern with target of well above 10$, Gold had a modestly good day.

Links :

USGS Gold Report

commodities charts: Platinum Futures


Click on the chart below to enlarge:

silver chart

Gold and Silver intraday spot charts

It appears like both gold and silver are pretty comfortable at current levels. I again re modified the wave counts (annotated on the charts). Silver had built an extended box formation and the breakout should be powerful – Up in my opinion.

The "professional" analysts are always looking for some kind of political news to explain the price of gold , but remember, this market is subject to growing demand and rigid to declining supply , the renewed recognition of gold as the base monetary asset and the waves of almost infinite paper liquidity looking for home… All are long term global forces.

Click on the charts below to enlarge:


Tuesday, January 24, 2006

Gold spot two hours chart

Gold channel chart still intact, silver actually behaved stronger today giving sign of an imminent breakout.


Gold Short positions

It is very difficult to know how much gold is really sold short because many trading houses are holding spread positions due to arbitrage trading. Also most of the positions seems to be OTC derivatives.

Here is a summery of the open Interest for the COMEX (NY) , CBOT and TOCOM (Japan), Options are not included.

COMEX (CFTC) : 361,704 x 100 oz = 36,170,400 oz
CBOT : (12,404 x 100 oz = 1,240,400 oz + 4,853 x 33.2 oz = 161119.6 oz) = 1,401,519.6 oz
TOCOM : 342,873 x 33 oz = 11,314,809 oz

COMEX + CBOT + TOCOM = 48,886,728 oz

Links :


BIS OTC DERIVATIVE REPORT REVIEW

DERIVATIVE OTC REPORT OCC

COMEX (CFTC)

CBOT

TOCOM

Monday, January 23, 2006

Gold 4 hours chart – modified wave count

Given the relatively deep correction gold had last week, I decided to modify my wave count for gold.

Click on the chart to enlarge:


gold spot chart

Few notes...

Gold channel chart still valid, Silver consolidating and might be coiling.

Please see latest copper chart for an inspiration of what movement gold can have. (Link)

I found this interesting information about gold content in ocean water:

"There are about 26,000 tones of gold in the ocean, about 5 grams for each of the 5 billion humans on the Earth."(Link)

Short study about gold short positions will be published soon.

Saturday, January 21, 2006

Thoughts on gold

Gold is neither holy nor sacred; I do not worship gold or anything else for that matter.
The purpose of this site is to share my thoughts and knowledge.
Many analysts tend to explain the movements in the price of gold with political events, I disagree about that. In my opinion the price of gold doesn't have much to do with politics like most analysts tend to think.

What are the drivers behind the price of gold?

The variables which determine the price of gold could be devised into two main groups:

Internal variables:

1) Physical gold supply(limited) and demand.

2) Paper gold (futures, options, OTC derivatives, CFD, ETF, etc.) supply (unlimited) and demand.

3) Crowd psychology regarding gold – is gold cheap or expensive?, should I buy, sell or hold?, why is the price going up or down? , fear and greed. Etc.

External factors:

1) Monies supply in the form of M1, M2, M3…Mn , for each currency C1, C2, C3…Ck, Subtotal of the summarize matrix {[Mn] X [Ck]}

2) Systematic risks and malfunctions of the global monetary system and the crowd psychology regarding those issues.

3) Inflations deflations debates, expectations and perceptions.


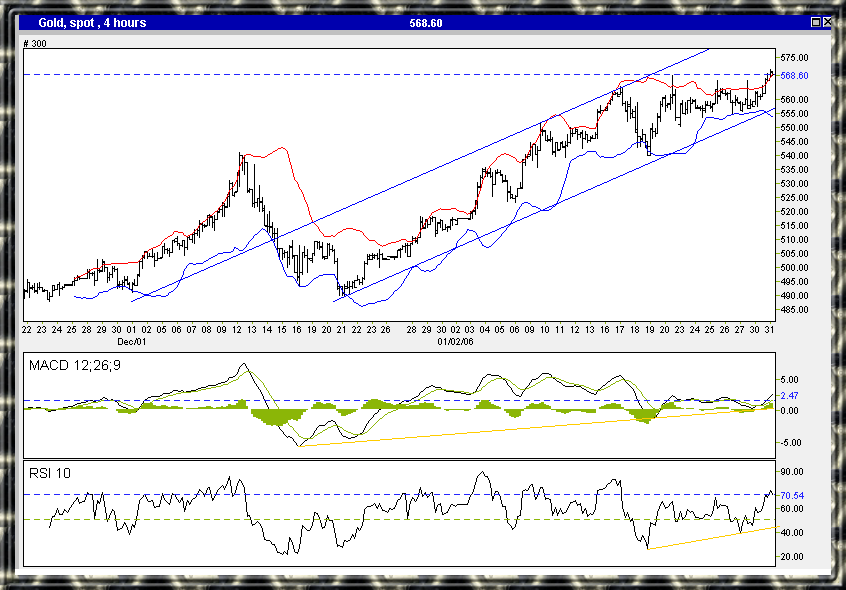
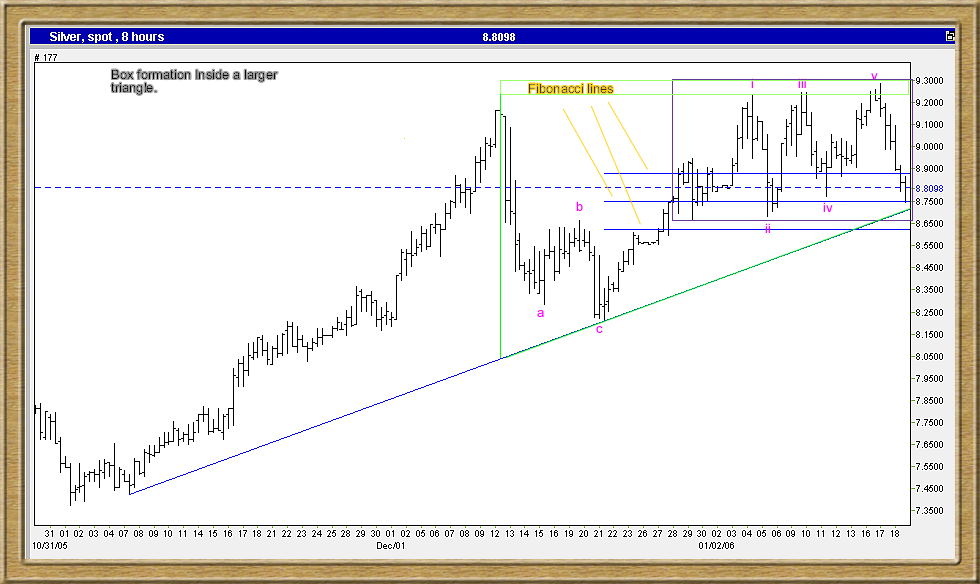
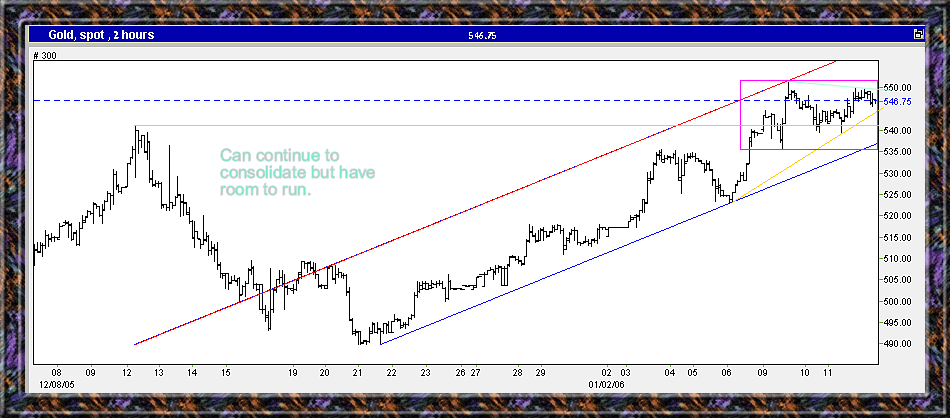
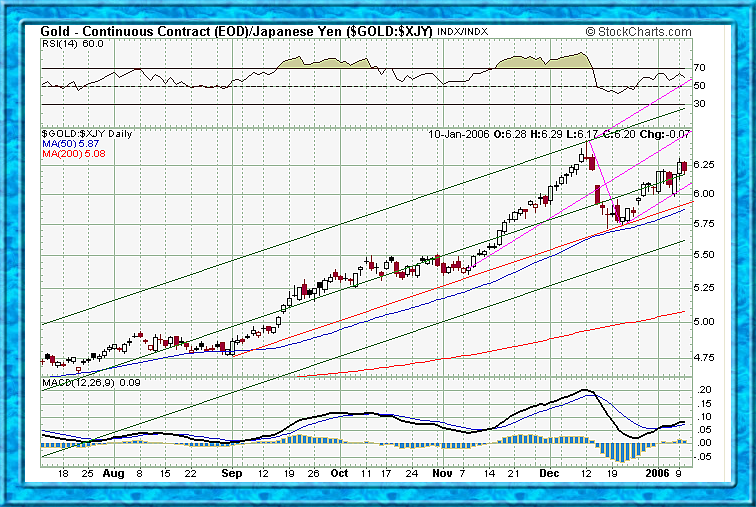
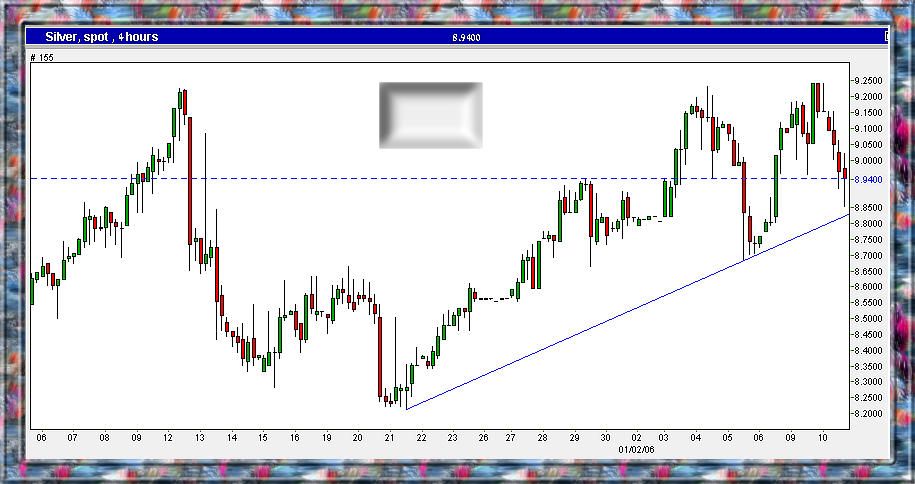
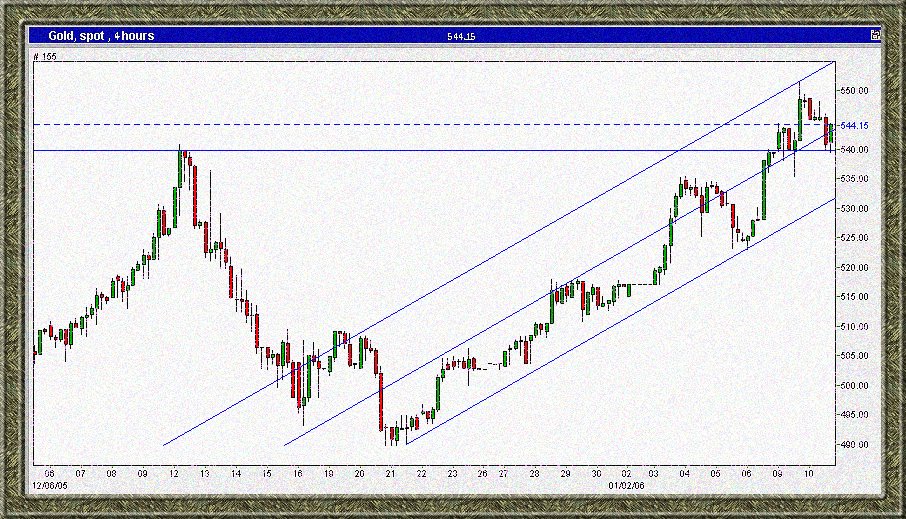
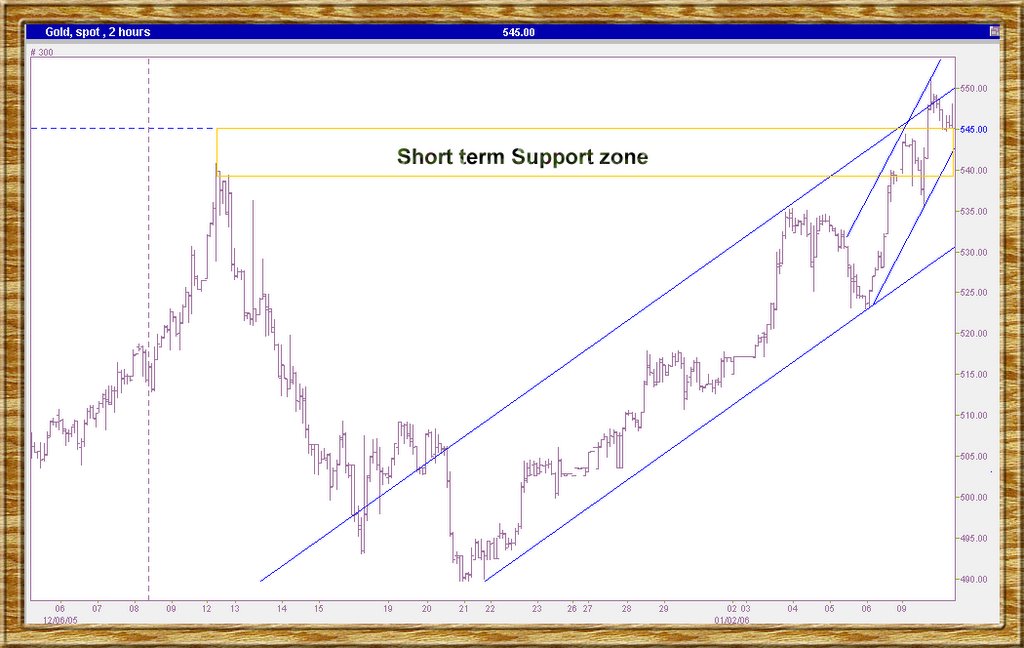
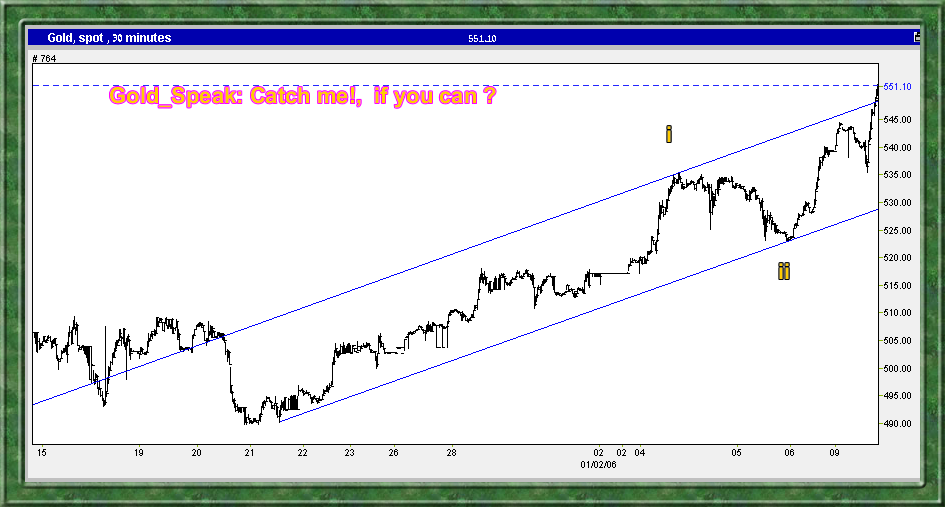
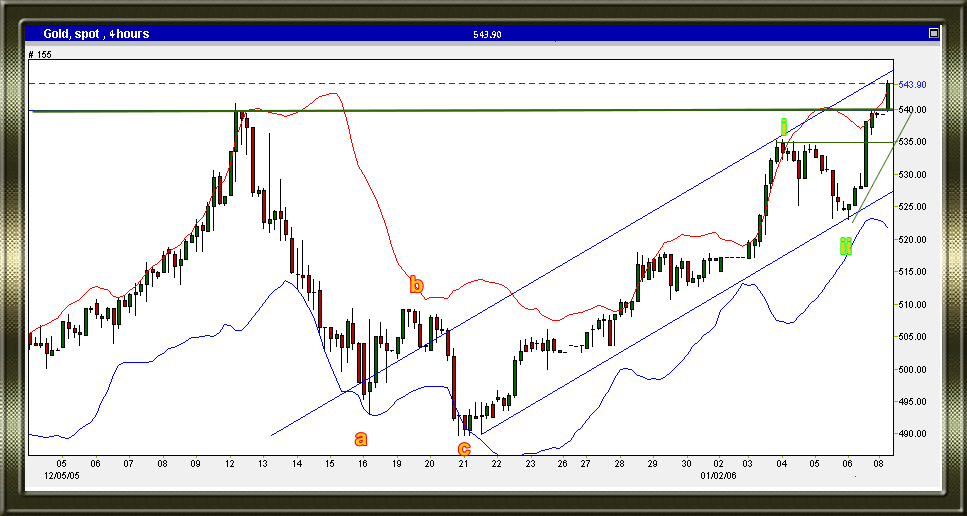
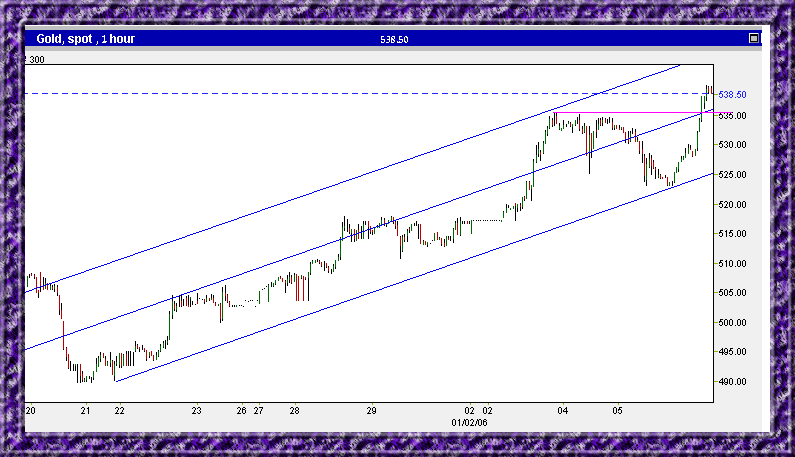
All of those are very complicated issues which are largely misunderstood even by the professional gold analysts. That’s my opinion and this is why technical analysis is so important when you want to understand the gold market.


More later real1.

Gold and Silver charts

gold spot chart
silver spot chart
gold spot chart

Friday, January 20, 2006

Dow Gold ratio

The Dow: Gold ratio is clearly on its second wave down, moving out of extreme cyclical valuation. History show that Dow is still much overvalued compared to gold.

Click on the charts below to enlarge:


Dow Gold ratio


Dow Gold ratio

Thursday, January 19, 2006

Gold and silver intraday charts

click on the charts below to enlarge:
silver chart
gold price

Some points about Gold , this Site(Blog) and Myself

1) Im not a multi millionaire investor, not a professional author and English is not my mother language. I would like to stay anonymous.


2) Gold is an asset with extraordinary bullish fundamentals and technicals. I'm biased to the bullish side looking for bottoms not tops , it will stay that way for some time I suppose.

4) One of the biggest misunderstandings in the Investment world is the difference between investing and saving. In my opinion it is very simple: investing is putting capital to work in an active way (building a factory or a mine for instance..) while saving is more of a passive way to use capital (usually in the form of buying something on paper from brokers or buying gold coin from bullion shops) and gold is an excellent way to save capital in my opinion.

5) This site is hosted on Google bloger network mainly for security and privacy reasons.

6) I don’t write much when there isn't something special to write about.

7) I put lots of effort updating this site , feel free to enjoy it and benefit . If you wish to support this work click on the "make a donation" button on the bottom of the page.

Gold 4 hours chart update

Gold probably bottomed right at it's last year top area around 540$, It will have to struggle with the downward slope. Later, real1.


Click on the chart below to enlarge:


Gold spot intraday chart

Wednesday, January 18, 2006

Silver 8 hours chart

Silver is trading near its 50% Fibonacci retracement level, again more volatile and leading gold on the downside.
I'm not sure at all about the wave count on the charts and will not be surprised to see strong upward action coming out of nowhere. More later.. real1.

Click on the chart below to enlarge:


silver spot intraday chart

Gold Intraday chart update

gold chart

Gold 4 hours chart

Currently gold is already 20$ below its recent top, the channel is slightly modified to reflect the action. I have also updated the wave count and outlined Fibonacci levels accordingly. Can't say much more right now, more later…


Click on the chart below to enlarge:


Gold spot intraday chart

Tuesday, January 17, 2006

Gold, Spot 4 hours chart

The uptrend is still intact and support is outlined on the chart for your convenience. The days when a 15$ sell off mean anything are over and traders might see this as a buying opportunity.

Click on the chart below to enlarge:


gold chart

Gold and Silver intraday charts

Gold and silver again traded at new highs yesterday and a modest orderly consolidation is welcomed before moving higer. The charts are building support zones and the outlook is positive in my opinion... More later real1.

silver spot intraday chart

Gold spot intraday chart

Monday, January 16, 2006

Gold and Silver 2 hours charts

The upward action simply continues and we should expect higher prices (exchange rates) on all time frames. Silver is lagging gold a little bit but as you well know that could change quickly. More later ... real1.

Click on the charts below to enlarge:


gold spot chart
silver chart

Saturday, January 14, 2006

Gold Oil ratio

The gold oil ratio is still historically very low, in other words: gold is still cheap also when compared to oil.

See my previous review of gold oil ratio (weekly chart):
http://globalgold.blogspot.com/2005_12_25_globalgold_archive.html
Oil itself has more then a few bullish fundamentals and seems at the beginning of a recovery from the latest correction. see oil charts here:
http://cmd-chart.blogspot.com
Overall and in my opinion both Gold and Oil are headed higher in 2006 but gold should finally outperform.

Click on the chart below to enlarge:

Gold Oil ratio chart

Friday, January 13, 2006

Gold new high


Here is a chart from 29 November, that’s what I was thinking back then, more later real1...


chart gold
gold price

Thursday, January 12, 2006

Gold 4 hours and Gold / Silver exchange rate charts

Again, not much change in the gold price today, the channel chart is looking good and from the intraday action its seems like support is being built.

The Ratio between gold and silver is about 60, so sixty oz of silver are worth one ounce of gold. The chart is building a 20 month triangle formation and later this year we should see one of them outperforming the other significantly.


gold price
gold silver ratio chart

Gold and silver 2 hours charts

Not much news, maybe just a bit broader crowd recognition of opportunity?
Seems like the metals are pretty comfortable at current levels and the outlook on all time frames is positive in my opinion. We shall see what happens next... more later real1...


* See my other site for commodities charts


real time price of gold
silver spot chart

Wednesday, January 11, 2006

Time to review the Gold : Euro & Gold : Yen exchange rates

Gold the ultimate Forex, for two decades it was somewhat misused by central banks, commercial banks and even some of its producers - the miners. Well, look like its time to pay the bill. Unlike other assets which have the benefits of: growth, dividends, competitive interest rates, etc. Gold is a rare metallic mineral, the money of nature, a currency with thousands years of history – that’s all and that’s enough.

Click on the charts below to enlarge Gold / Euro & Gold / Yen exchange rates charts.


gold yen chart
gold euro chart

Gold one hour chart

Consolidation still under way, watch for a break above the minor downtrend line for a short term buy signal. Good support at appropriate Fibonacci retracement lines.

Click on the chart below to enlarge:


gold chart

Tuesday, January 10, 2006

Gold and Silver 4 hours charts

Nothing much to say, a bit of consolidation, possibly some profit taking and more shorts trying to catch tops- Will only serve as jet fuel for the next rally which could come real soon. In my opinion the real party will only start once gold will take out its all time high of 1980. More later… real1.

* Platinum had a good day.


silver spot chart
gold spot chart

Gold & Silver 2 hours charts

gold spot chart
silver chart

Monday, January 09, 2006

Gold 30 minutes chart special update

Here we are at the 550 USD / OZ level, the action is very strong and the upside slope is sharp, all for a good reason.

Please review The Great Gold Paradox (part 1 - 3):

http://globalgold.blogspot.com/2005_12_18_globalgold_archive.html

http://globalgold.blogspot.com/2005_12_25_globalgold_archive.html

Click on the chart below to enlarge:

gold chart

Gold and silver synchronization

Gold and silver are moving together hand in hand. Not surprisingly gold and silver are having a very similar wave count.

Click on the chart below to enlarge :


silver chart

Sunday, January 08, 2006

Gold spot 4 hours chart

New high, good support below so a any pullback should be very shallow. After all gold should not be cheap forever, right?

chart gold

Friday, January 06, 2006

Gold spot one hour chart + OCC report

Impressive!

Click on the chart below to enlarge:


gold chart


Please review this OCC Derivative report.

Gold spot one hour chart

Very Interesting action for gold , see new support line on the one hour chart and a possibility of constructing a box formation. If the support line goes watch the Fibonacci lines, keep an eye on silver and the rest of the precious metals complex.
More later …real1.

Click on the chart below to enlarge:


gold chart

Thursday, January 05, 2006

Gold & Silver 1 hour charts

Nothing goes straight up, so are gold and silver. Silver was leading to the upside (rallied 100 cents with no corrections) and now leading to the downside, already touched its 50% Fibonacci retracement line. Gold did not pull back much like silver and shouldn’t go much lower then the 38.2 Fibonacci retracement line( if any). You can use this opportunity to add more positions.

Click on the charts below to enlarge:


silver chart
gold spot price

Gold 4 hours chart

gold spot price

Wednesday, January 04, 2006

Gold & Silver 4 hours charts

Some intraday consolidation for gold and silver, Still very strong action and up trends lines in place.

Click on the charts below to enlarge :


gold price
silver chart

Gold 8 hour chart

It was an excellent new year start for gold , silver and their indices. The 8/24 hours gold spot chart is annotated with a 3 parallel lines to make it easier to see where things are probably headed and what performance one should expect from the Forex of nature.
In the future I might post some gold and silver stocks charts but I want to warn you that the stocks tough can and do outperform the physical stuff are very different from the metal itself for obvious reasons.
So is the futures, cfds , options , derivatives ..etc- which are all paper gold instruments and under some circumstances could be defaulted .


Gold intraday chart

Search

SUBSCRIBE

Gold Global Perspective Feed

AddThis Social Bookmark Button AddThis Feed Button

Archive

Labels