At February 10, 2006 I posted that I see a
pattern of inverted head and shoulders on the Gold / Oil ratio chart. Since then the gold / oil ratio moved higher, closer to the pattern price target of ~ 11.50. Oil and Gold both moved higher but gold have outperformed oil (gained more percentage). At April 14 , 2006 I posted an oil chart -
New all time high for crude oil (WTI) , and indicated a price target of 81$ per barrel of WTI crude oil. 81$ x 11.5 = 931.5$ per gold oz, this price target is less then one percent lower then the price target of 939$ per gold oz - which is based on the average positive rate of change for gold since the start of the second leg up (Elliott Wave III) of the great global gold bull market (GGGBM) – see
Gold price prediction 2006, see also
The importance of the Dow Jones / Gold, Gold / Oil & Gold / Silver ratios.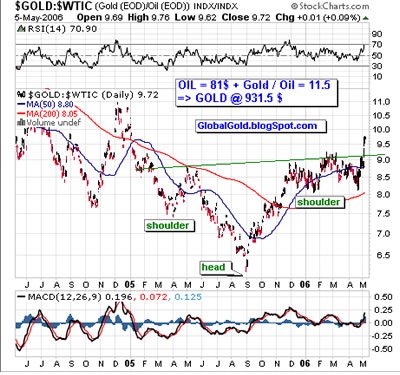 Van Eck Seeks SEC Approval for Gold Shares ETF


2 comments:
I've read that the long-term average of the Gold / Oil ratio is 9.5, with a peak of 15 in Jan 1980.
Assuming oil hits USD$100, gold would be USD$1500.
But at such high oil prices, the likelihood of global recession seems real. This could break the Commodity Supercycle based on the China and India economic blooms.
If delation takes root, then oil demand falls. So will gold?
I think the deflation scenario is unlikely due to the very high amount of global debt , especially in the developed economies. But even if the deflation scenario is to occur gold might actually go higher… So many reasons for gold to go higher…
Post a Comment