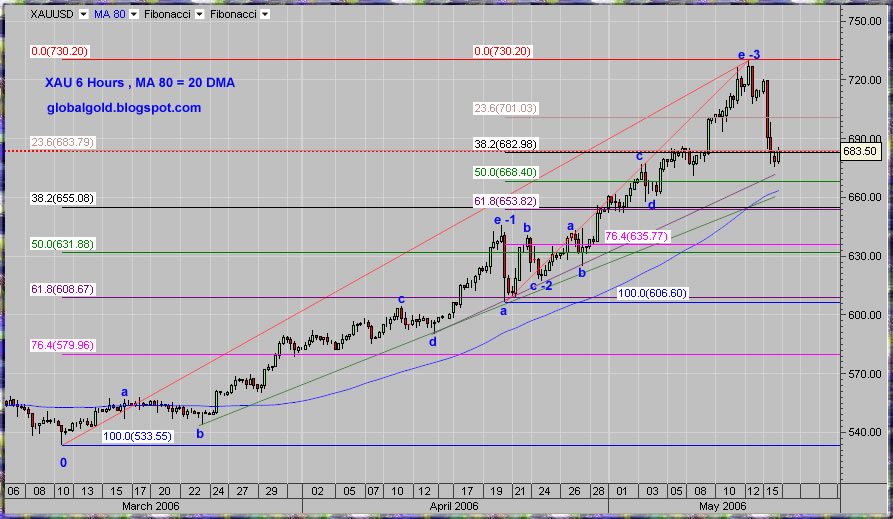
Gold traders learned today what silver traders already know: under some market conditions and certain technical formations the gold market can do quick and sharp sell offs. The gold market is attracting more and more forex traders which are usually using high level margins (x10 , x20…). This sharp pullback has certainly cleaned some of the excessive short term gold speculations. Time will tell how long it's going to take for the gold price to make a higher high, in my opinion – not to long.
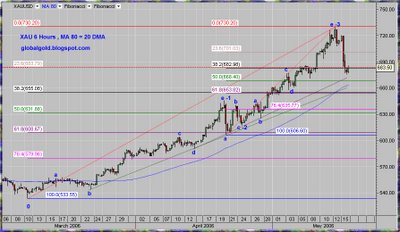
Here is six hours spot gold chart. The chart is annotated with two sets of Fibonacci lines, Elliott wave count and diagonal trend lines, click on the chart below to enlarge:


No comments:
Post a Comment