


- Long term silver charts
- TSX Group Announces Global Gold Index
- Platinum, Palladium, Rhodium, Ruthenium & Iridium Supply Demand Analysis Report
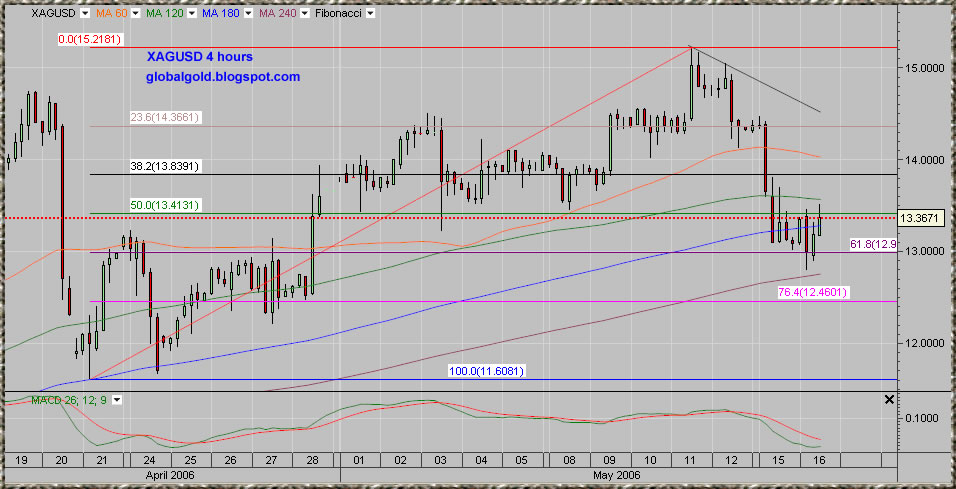
For viewing charts and pictures I recommend using Firefox browser – it usually handle image and picture files better then Internet Explorer. You can find a button link for Firefox at the left bottom of this page, click on the chart below to enlarge:

No comments:
Post a Comment