


The gold price hit a bottom at ~674$ then rallied ~30$ , here is an Intraday spot gold chart with Fibonacci support lines , moving averages and trend line , there are numerous other technical indicators but I find this most useful. – this blog is focused mainly on the price of spot gold and silver , my other blogs are focused on commodities in general and gold , silver , metals mining stocks, If you are looking for an excellent capital markets & social equity blog I highly recommend Bill Cara.
Click on the chart below to enlarge: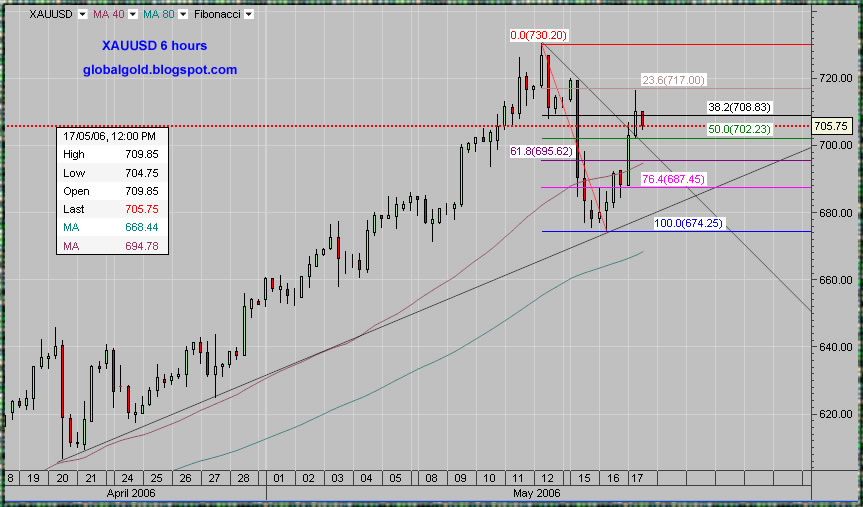

No comments:
Post a Comment