


Monday, June 05, 2006
XAUUSD, Spot Gold Elliott Wave Count Analysis
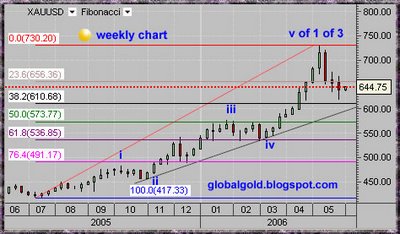
The Gold Silver ratio (XAU / XAG) = ~ 50.66, Dow / Gold = ~ 17.44, Gold / Crude Oil = ~8.75. Gold have pulled back 112$ since it's recent top and there are three red candles in a row for the first time since what I "believe" is the start of the Third wave up. Obviously there is a serious technical damage and this correction is the largest the gold market has seen since the beginning of the third wave up. Nevertheless I do not think that the gold market fundamentals have changed and I still see great opportunity in buying gold. Here is a Weekly spot gold chart annotated with Fibonacci lines and new Elliott Wave count:
Subscribe to:
Post Comments (Atom)

3 comments:
Watching that count, i belive, that the downtrend is still on his way, and the line 2-4 should be touch in any moment.
The best buying oportunities will occur in the 50%-61.8% retractment, specially in the 585 level, witch is a big support. Until we don´t see a higher maximun in a weely chart I still will remain bearish.
A pleasure to study your charts.Thanks
Bookmarked this. Thanksgiving owing to you looking for sharing. Positively value my time.
This is a superior article as they all are. I bring into the world been wondering nearly this as some time now. Its notable to receive this info. You are fete and balanced.
Post a Comment