


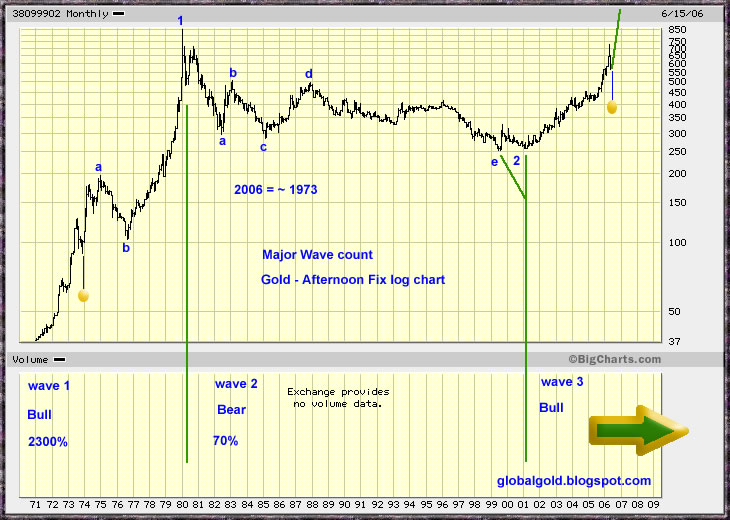
The market reaction to the end of the official gold standard was a ten years bull market rally (wave 1) that took gold from 35$ to ~850$ (2300%) . The gold peak of 1980 followed by a twenty years gold bear market that took the price of gold as low as ~250$ (wave 2) , 600$ (70%) decline. The gold price bottomed around 250$ and then it rallied almost 200%, this is the third major Elliott wave. Wave three usually tends to be extended both in time and price.
If the third Elliott wave will match the first Elliott wave then the top of the third wave should be around 6000$ per gold OZ - I know that’s sounds unreasonable right now but that is a conservative target based on pure Elliott wave analysis.
If you are new and interested with Elliot Waves - see this excellent Elliott wave tutorial by EWI (free registration is required).
Here is a gold price fix chart with Elliott wave count. Looking closely at the chart, the price of gold is behaving similarly to 1973. (Click on the chart to enlarge)

3 comments:
This is an excellent chart, real1. However, I have a slightly different interpretation of the chart.
First off, I would like to say that I agree. The move from 1980 to 2001 was a Wave 2 correction and that gold is just beginning a giant multi-year/decade Wave 3 advance.
However, in order to get a better handle on the wave count, do you know where the .382, .50, and .618 retracement levels are for the current advance from $260/ounce to $720/ounce? My 'eyeballs' are telling me that there is strong support in the $350 to $450 price range.
I agree. This selloff is 'annoying' as all getout, but the good news is that this will also be providing a once-in-a-lifetime buying opportunity. It takes great courage and fortitude to ride out a "bucking bronco", so, hang in there!
V/R
bubble_watcher
Thanks bubble_watcher ,
Using your numbers(260$ & 720$ )
38.2% = 435$
50% = 490$
61.8% = 544$
So... Gold just hit the 61.8% Fib.
Lets see what happens next.
The Above chart is not a prediction - just observation.
Only problem I have with this count is according to the elliott wave principle, triangles are never found in 2nd wave corrective moves. Trend may be upward but these rules should never be violated or else they can prove damaging later on.
Post a Comment