


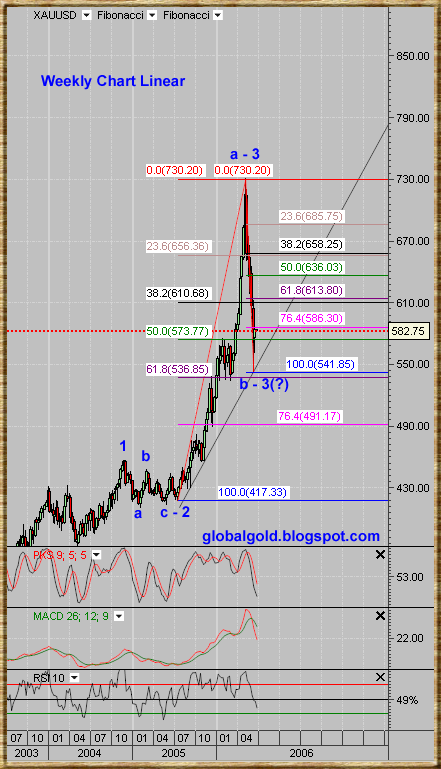
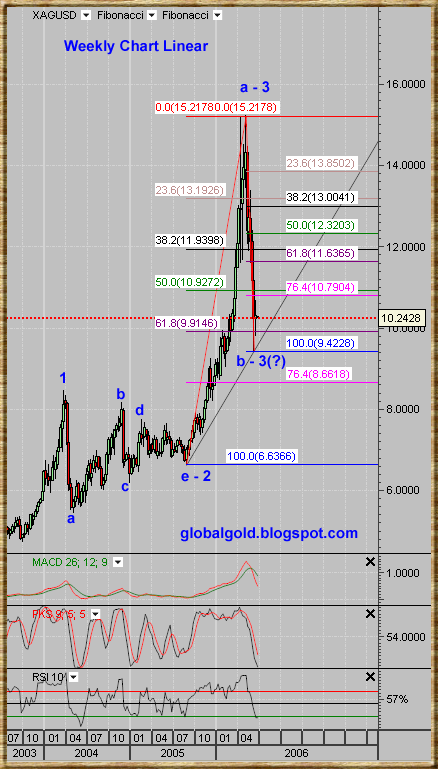
If my Elliot Wave Count Is correct and the bottom is in (b of 3) both gold and silver are at the very beginning of an extensive impulsive wave c (or 3) of 3 which will be more wild and more extensive then any thing the gold and silver market have witnessed before in this great global gold and silver bull market.
Whether you are an Investor or a trader this are the most relevant Fibonacci lines for spot gold (XAUUSD) and spot silver (XAGUSD).
For reference please see this long term gold chart.
See gold and silver stocks (GG, SLW, AUY, TRE) chart analysis.
Free Elliot Wave Tutorial (For EWI club members).

No comments:
Post a Comment