


Gold encountered early selling pressure but somehow managed to overcome.
Some positive technical developments:
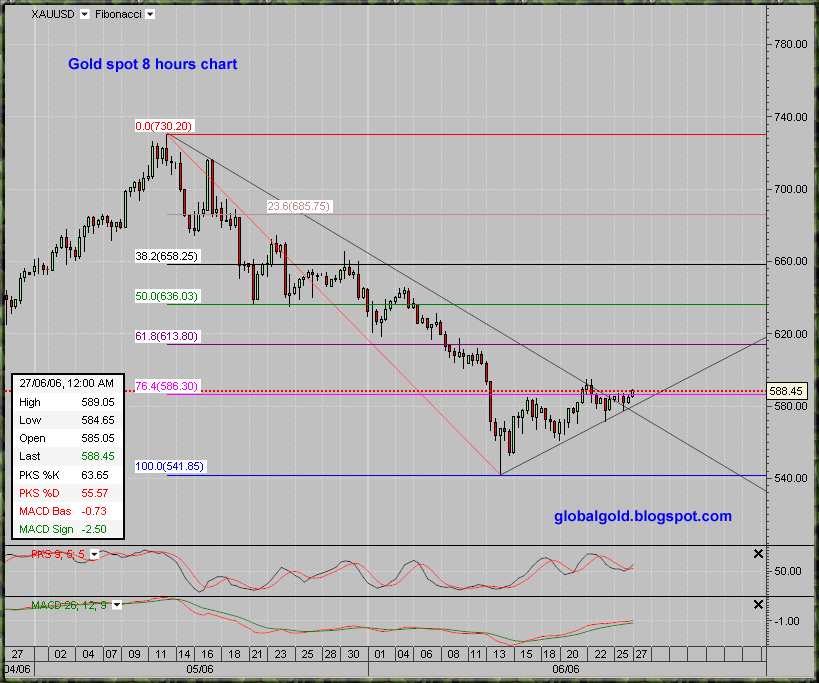
- The price of gold managed to cross the diagonal downtrend resistance line coming from the 730$ top.
- Gold is now again above the 76.4% Fibonacci line on the 8 hours chart.
- The price of gold have constructed potential head & shoulder pattern on the 1/2 hour chart , the initial price target for the pattern is ~603$ per gold ounce.
Few hurdles are standing on the way but the bottom should be realized by market participants.
Enlarge charts for better view:


No comments:
Post a Comment