


The Bull market in gold is alive and raging but just like the rodeo it will not be an easy ride.
Next week we might see a pull back to the 76.4% Fibonacci level (~586$), consolidation around the current price or further rally to the 50% Fibonacci level (or higher). This is a wild bull market in gold and If my Elliott Wave analysis is correct this is Wave iii of 3 of III which can be extremely impulsive volatile and extensive.
Related:
Commodities Important news and charts - link
Gold and Silver Stocks reviews - link
Elliott Wave Tutorial (Free for EWI club members) -link
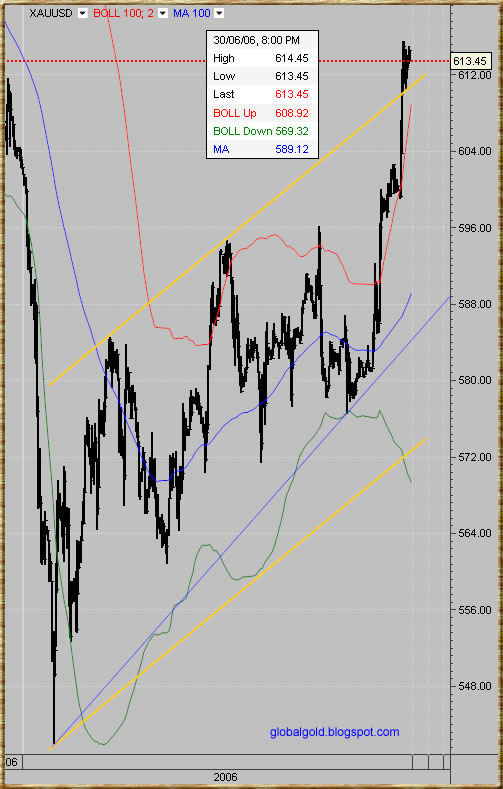
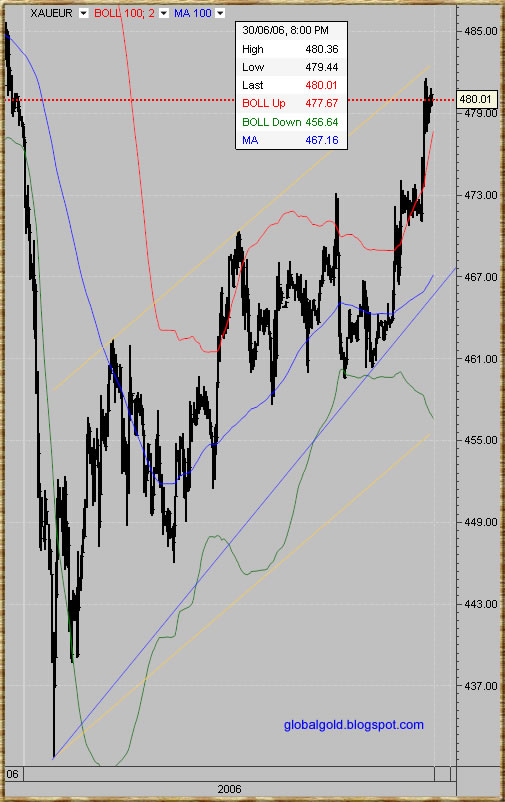
Here are spot gold XAUUSD ; XAUEUR one hour bar charts with 100 MA Bollinger Bands (STD=2).

1 comment:
Hey i am suuper boy
Post a Comment