CPM Group have published their Silver 2006 year book:
http://www.thebulliondesk.com/content/reports/tbd/temp/CPMPR.pdf
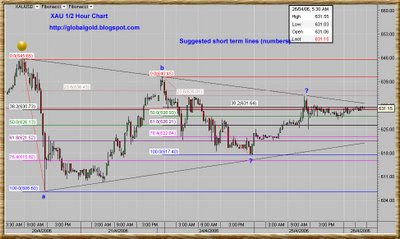
Click on the chart below to enlarge and see suggested short term lines (numbers)

Commodity charts : Orange Juice Futures (OJ) , Live Cattle Futures (LC) , Gold and Silver Stocks


2 comments:
Tks for the article.
With silver mine ouput expected to increase 2.9%, in contrast to industrial and jewelry/silverware demand declining by 5-6%, I wonder if the new investor demand is enough to continue to push up silver prices.
Btw, here is a TA analysis on spot silver.
http://futures.fxstreet.com/Futures/images/graf/mizuho/spotSilver.pdf
"Overexposure in the media has made (silver) vulnerable to big swings and dramatic pullbacks (as seen in the 20% drop in 24 hours last week). The combination of this sort of move from long term resistance and a massive ‘doji’ candlestick on the weekly chart suggests consolidation below $15.00 for several weeks if not months. We now feel that this will be more of a two-way market, with rallies towards $14.00 seen as selling opportunities for another test of Thursday’s low at $11.60 and possibly below here to $10.50. Below the psychological $10.00 is considered very unlikely.
A sustained break above $15.00 is unlikely in the near future except in the case of extreme US dollar weakness, but would signal the resumption of the very long term uptrend."
Your previous post on trend-line support for silver above USD$10.5 seems validated by silver's current support at USD$11.60.
Overall I'm expecting some consolidation around current levels then a retest of the last high and the 15$ area . Probably to higher high..
Post a Comment