


(Originally posted Saturday, January 21, 2006)
Gold is neither holy nor sacred; I do not worship gold or anything else for that matter. The purpose of this site is to share my thoughts, knowledge and charts.
Many analysts tend to explain the movements in the price of gold with political events, I disagree about that. In my opinion the price of gold doesn't have much to do with politics like most analysts tend to think.
What are the drivers behind the price of gold?
The variables which determine the price of gold could be devised into two main groups:
Internal variables:
1) Physical gold supply(limited) and demand.
2) Paper gold (futures, options, OTC derivatives, CFD, ETF, etc.) supply (unlimited) and demand.
3) Crowd
External factors:
1) Monies supply in the form of M1, M2, M3…Mn , for each currency C1, C2, C3…Ck, Subtotal of the summarized matrix {[Mn] X [Ck]}
2) Systematic risks and malfunctions of the global monetary system and the crowd psychology regarding those issues.
3) Inflations deflations debates, expectations and perceptions.
All of those are very complicated issues which are largely misunderstood even by the professional gold analysts. That’s my opinion and this is why technical analysis is so important when you want to understand the gold market.
GDX – Gold Miners ETF – chart analysis.
The Hedge Book Q2 2006 , Hedge Impact declines by 5.1 Moz
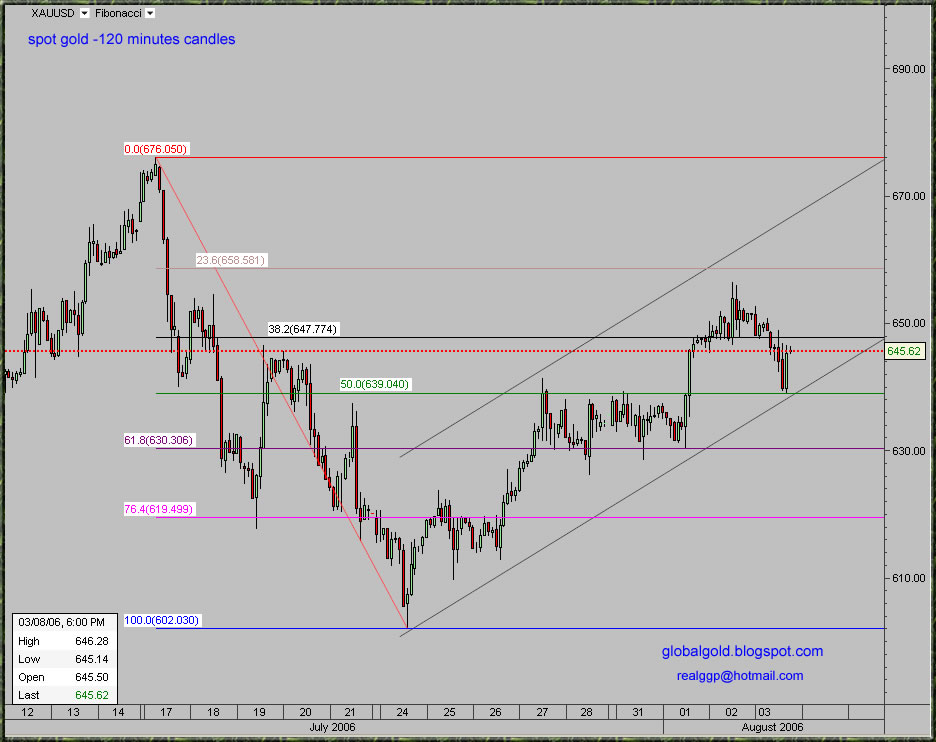
Currently gold is trading between the 38.2% and 61.8% Fibonacci lines. The trend is higher but some consolidation might be expected.
Click on the chart below to enlarge:

2 comments:
Hello!
Very interesting your site. Visit my blog. It´s sure that you will like it.
http://oceanodeluz.blogspot.com/
Greetings,
Hugo.
Have to agree. This definitely looks like an impulse wave off the lows with a wave 2 pullback that is now underway as a part of the current consolidation. Overall, the chart pattern looks very bullish.
/R
bubble_watcher
Post a Comment