skip to main
|
skip to sidebar
Gold Global Perspective
Gold, Silver & Forex Charts, Technical Analysis , News, Reports & Commentary.
Gold & Silver Mining Stocks
Loading...
Commodities Charts
Loading...
Gold / Silver Blogs
Canadian Silver Bug
Gold equals money
Gold Prices
Gold Stock Bull
Gold Stock Prophet
JSMineSet
Franklin Sanders
Money & Metals
Oikonomika
Optimist
Paint Charts
SilverAxis
Sufiy
Blog $ / :)
Alpha Trends
Anti-Sopitalist
Bill Cara
Biohealth Investor
Commoditytrader
COTs Timer
Dr. Housing Bubble
ELLIOTT WAVE lives
Globetrader
Grace Cheng Forex
Investing Middle Way
Metal Trading
Mish's Analysis
Michael Seneadza
Planet Yelnick
Sports Trader
Stock Psychology
Tim Knight
Tuesday, August 01, 2006
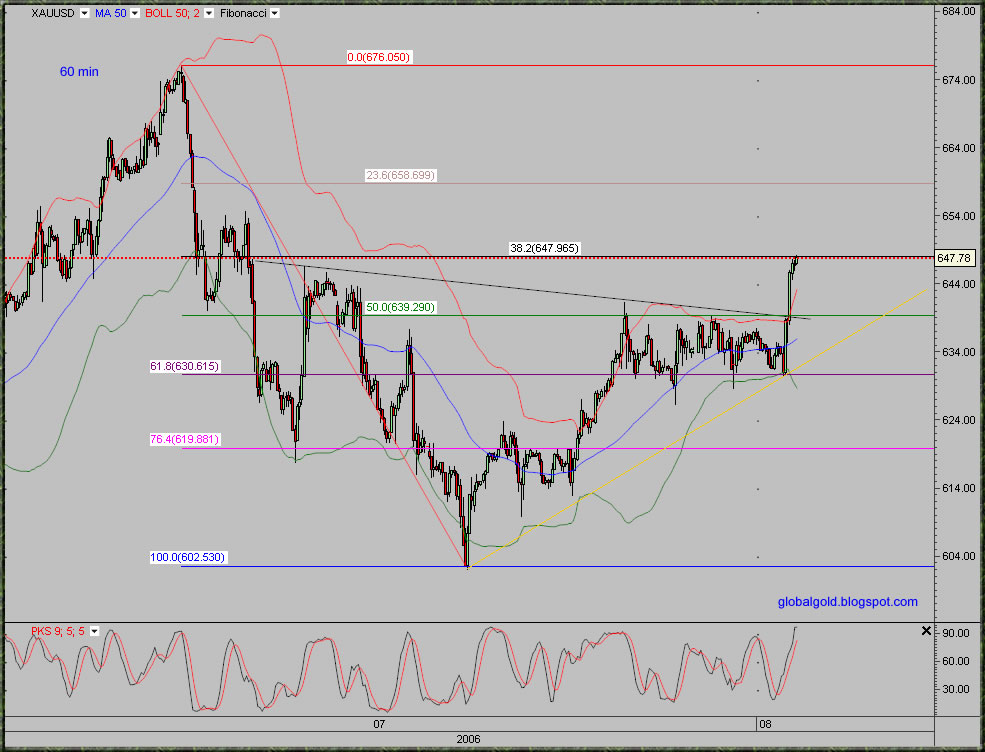
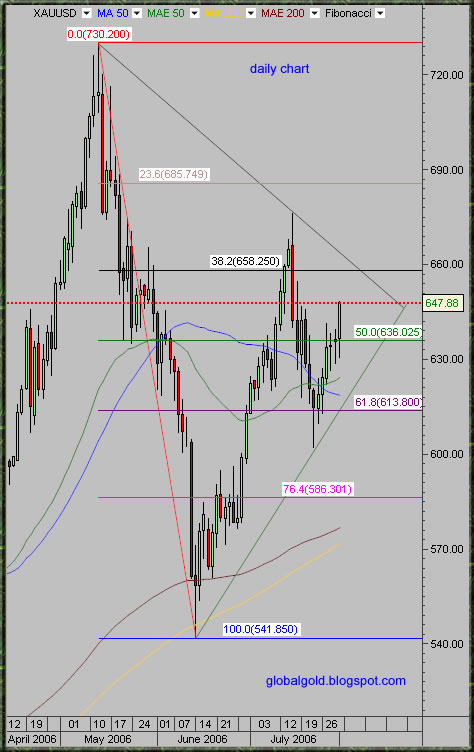
Spot Gold Charts
Good day for gold and silver. Gold moved higher to test resistance at the 38.2% Fibonacci line (see the first chart below), 50% Fibonacci line at 639$ - previous resistance is now first short term support level.
Click on the charts below to enlarge:
No comments:
Post a Comment
Newer Post
Older Post
Home
Subscribe to:
Post Comments (Atom)
Search
SUBSCRIBE
Archive
►
2009
(1)
►
January
(1)
►
2008
(22)
►
December
(1)
►
November
(1)
►
September
(2)
►
August
(1)
►
July
(4)
►
June
(5)
►
May
(2)
►
April
(3)
►
March
(1)
►
February
(1)
►
January
(1)
►
2007
(85)
►
December
(1)
►
November
(1)
►
October
(2)
►
August
(2)
►
July
(14)
►
June
(11)
►
May
(13)
►
April
(16)
►
March
(11)
►
February
(11)
►
January
(3)
▼
2006
(241)
►
December
(6)
►
November
(7)
►
October
(7)
►
September
(7)
▼
August
(16)
Spot Gold daily chart
Gold (ZGZ6) short term intraday chart
Spot Gold Intraday Chart
Gold Market Overview
Gold and Silver Mining Stocks
Intraday Gold Charts
Investing the Middle Way: Guide to investing in go...
Gold and Silver Technical Update
Fibonacci and Parabolic Moves
Gold Elliott Wave Count - Update
Gold and Silver –Charts & Commentary
Gold / ($, €, ¥) & Silver – Charts
Thoughts on Gold + Intraday Chart
Silver Weekly Chart
Spot Gold Charts
Tight trading range for gold ?
►
July
(27)
►
June
(24)
►
May
(30)
►
April
(23)
►
March
(24)
►
February
(28)
►
January
(42)
►
2005
(21)
►
December
(21)
Labels
BIS
(8)
blog
(8)
CBOT
(23)
Central banks
(26)
Cheuvreux
(1)
China
(21)
COMEX
(26)
Commodity
(12)
Crude Oil
(11)
DGCX
(3)
Dow Jones
(10)
Elliott Wave
(77)
ESF
(2)
Euro
(28)
Fibonacci
(121)
Forex
(34)
Fun
(2)
Germany
(1)
Ghana
(1)
GLD
(10)
gold
(324)
Gold Coin
(3)
Gold ETF's
(3)
gold stocks
(18)
GOX
(1)
HUI
(7)
IMF
(4)
India
(12)
Inflation
(2)
Iran
(4)
Japan
(7)
Korea
(1)
Metals
(4)
Mexico
(1)
Nanotechnology
(1)
Nasdaq
(1)
OTC derivatives
(5)
Paul Mylchreest
(2)
Purity
(2)
Russia
(7)
Silver
(114)
Singapore
(1)
SLV
(5)
South Africa
(3)
Swiss
(3)
Taiwan
(2)
Thailand
(1)
TOCOM
(4)
Trading
(87)
Turkey
(1)
UK
(2)
USD
(21)
Weight
(1)
XAG
(2)
XAU
(8)
Yen
(24)
ZGLD
(1)
Commodity Charts
Gold & Silver Stocks
HUI
XAU
GDX


No comments:
Post a Comment