Gold found some kind of bottom at 607$ and currently trading about 20$ higher. Below is spot gold bid price 120 minutes candles chart. August was not a good month for gold but there is still some time for repairs. The chart is annotated with new short term Fibonacci numbers and minor Elliott wave count for your convenience.
For the watch list -
VGZ , MNG - charts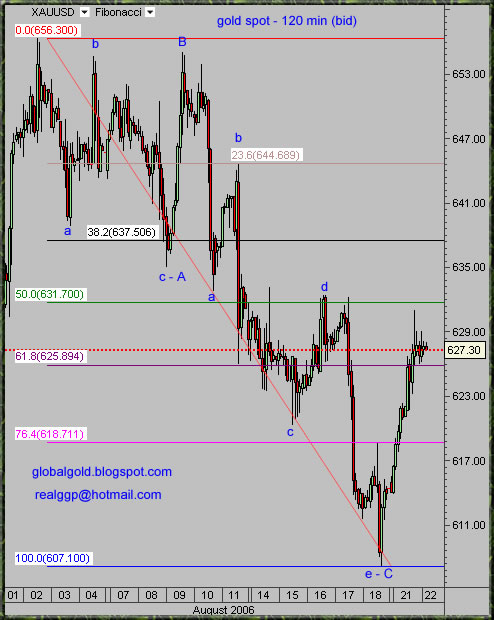


No comments:
Post a Comment