


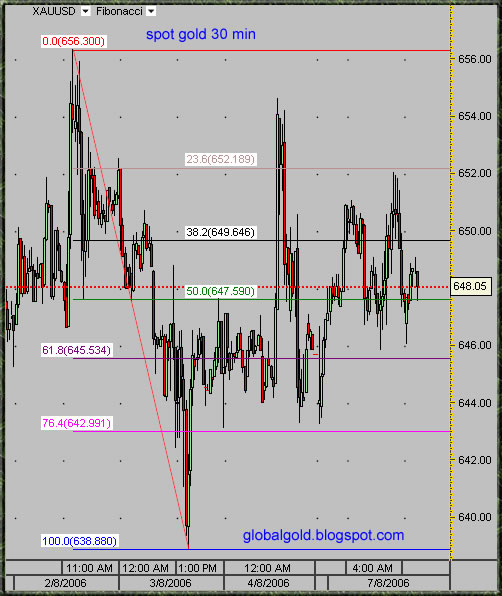
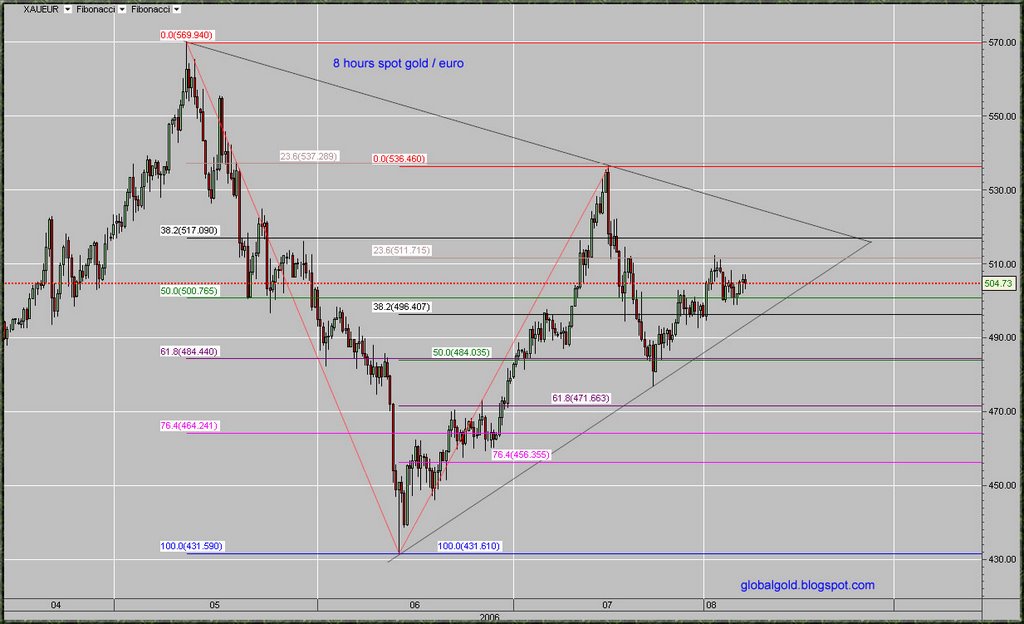
Looking at the 3 month gold charts – gold formed a triangle pattern which is not yet completed. The pattern is similar for Gold/USD, Gold/Euro and Gold/Yen. Silver already broke above its diagonal resistance and consolidates around the 50% Fibonacci line (~12.30$).
It is quiet possible that gold will continue to consolidate around current levels (638$ - 656$) further consolidation is also possible and gold can go as low as 620's (not likely). IF gold can break above the diagonal resistance line, that will ignite a serious rally (I think it can).
As of now, nothing more to report other then:
CBOT (August 4, 2006) system failure - link
China's silver consumption triples
(Xinhua)Updated: 2006-08-07 16:20
China consumed 2,600 tons of silver in 2005, nearly three times the volume of twenty years ago, said sources with the Gemological Association of China.
But the country exports even more than it consumes. With an all-time record production of 7,196 tons of silver in 2005, China has become the world's third biggest silver supplier.
Exports of silver rose to 4000 tons in 2006, up by a third from the 3050 tons notched up in 2004.
Consumption at home surged 190 percent to 2600 tons in 2005 from a modest 900 tons in 1985. Despite the constant fluctuations in the prices of gold and silver on the international market, China's silver consumption has continued to grow steadily in recent years, said the association.-link.
See also:
Gold and Silver Stocks
Commodities Charts
Click on the charts below for enlarged view:


No comments:
Post a Comment