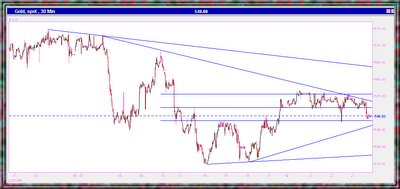
Gold pulled back today and is currently trading just above the 38 Fibonacci line, not a big deal if you ask me. The triangle formation is still constructing itself and technically the short term situation is somewhat unclear. This week gold traded in a relatively narrow range of about 10$ and it seems like the 550$ level perceived as acceptable between the buyers and sellers. I assume that the tight trading range caused the speculative players to temporarily leave the market and a bit of more consolidation will be healthy. If you are looking for other speculative ideas check out John Rubino
latest commentary.
Silver continue to trade very similar to gold both in terms of direction and tight trading range. The last couple of weeks the general commodities market corrected nicely and current levels should be seen as buying opportunity , see the CRB chart
here.
Click on the chart below to enlarge:


3 comments:
Hi, your daily gold charting and reports are an important regular read for me. It helped me to decide to buy some GDL ETF shares when the price of gold corrected to USD540.
While I beleive we are in a commodities / gold bull, I have also been concerned on how to determine the fair value/price of gold.
http://www.gold-eagle.com/editorials_05/schwensen110205pv.html
The above link seems to provide a good forumale to arrive at gold's fair price.
For sharing.
Please excuse me but I can not give a short answer .
I will soon write a post regarding gold "Fair" price, so check back later...
I have been following a site now for almost 2 years and I have found it to be both reliable and profitable. They post daily and their stock trades have been beating
the indexes easily.
Take a look at Wallstreetwinnersonline.com
RickJ
Post a Comment