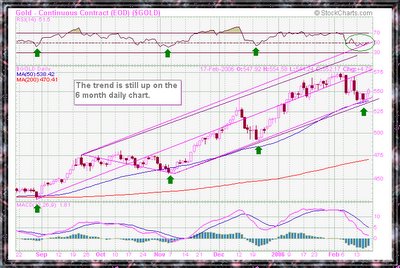
As appears on the daily chart below gold short term trend is still up. The channel is still intact and the price of gold is close enough to the bottom of the channel, the top of the channel is currently above 600$ and raising. I cannot guaranty that the eight days or so correction is over but it appears that the bottom of the channel, the Fibonacci retracement lines, the 50 days moving average and 2005 highs gave enough support for the price of gold to bottom and reverse.
Click on the chart below to enlarge:


No comments:
Post a Comment